Debugging Server Side Google Tag Manager

Management Summary
Are all your tags firing correctly in GTM with server side? This step by step guide to debug your tag manager implementation will help you out.
How to debug a server side setup in Google Tag Manager
If you have worked a bit with Google Tag Manager, you know how to open preview mode and test your tags. You know how to check triggers and variables so see what needs to be changed to get the data you need all the way to the tracking tool of your choice.
With the introduction of server side tagging, debugging in GTM has gotten more complex. In this post we will look at what to look at when debugging a server side set up in Google Tag Manager. For that you need to look in both the preview mode of your client side container and your server side container.
The basics
First, let’s look at how information flows between the website and your end destination when you are using a server side set up.
Preview mode
Open preview mode first in your server side container. There might be an option to choose which environment you want to debug if you see the three list symbol to the right of the preview button.
Server side preview mode. Source: GTM
This could be if your site has a test version where you can see features before they are launched or make a purchase without actually placing an order.
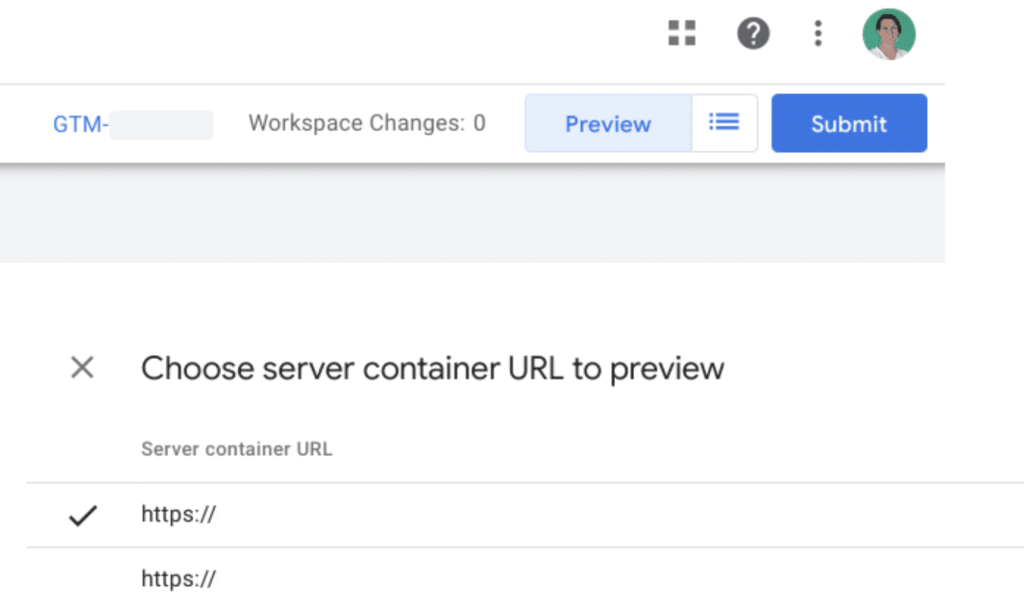
Pick the right url for the version of the site you want to debug and click preview, this window opens:
Server side preview open. Source: GTM
If you do not know which url to pick, you can try one and if you see no data when debugging, switch to the other url and test that one instead.
Client side container
Then open your client side GTM preview like normal. Here you can trigger an event and validate that your server side tags fire when they should.
Server side preview open. Source: GTM
Server side container
Then go over to the server side preview tab. In the left column, instead of seeing what happened in the dataLayer, you will see which requests were sent to the server side container. If you for example test a GA4event that fired in the client side GTM you will look for that event name in the server side preview.
For each request that comes to the server side container there is a lot of information available, divided into different tabs. Let’s look at them one at a time:
Event data
In this tab you find data that comes with the client side request. It will contain the parameters you set on the client side tag. It also includes automatically collected information about for example the browser, consent state or if the event triggered a first_visit or a session_start.
Event data is the server side equivalent to the dataLayer, it is the information that the server side container receives and potentially transforms before it sends it off in the different tags.
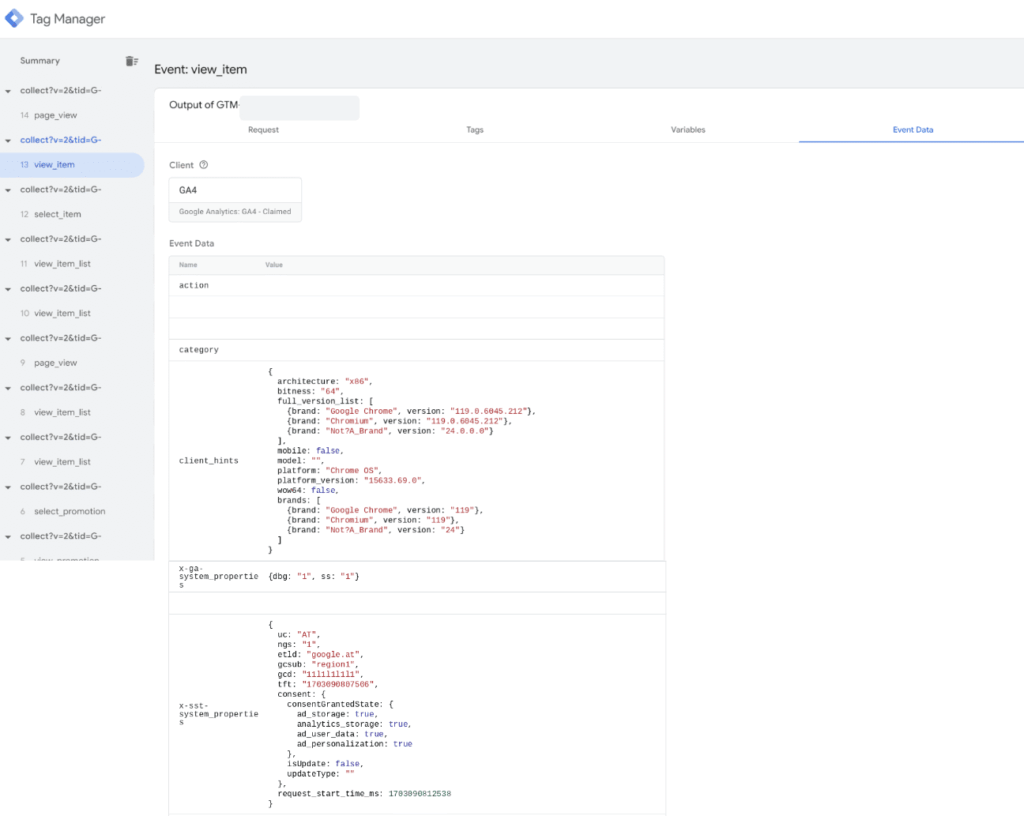
Event data. Source: GTM
Variables
In this tab you will find the values on the current event of the user defined or built in variables that you have added to the server side container. This works just like in a client side container. The difference is the types of variables that are available. For example instead of dataLayer variables, there are event data variables that pick up information from the event data we looked at earlier.
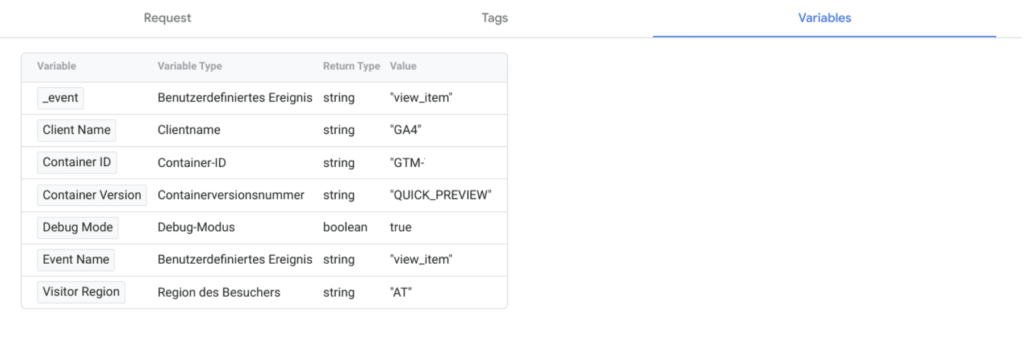
Variables. Source: GTM
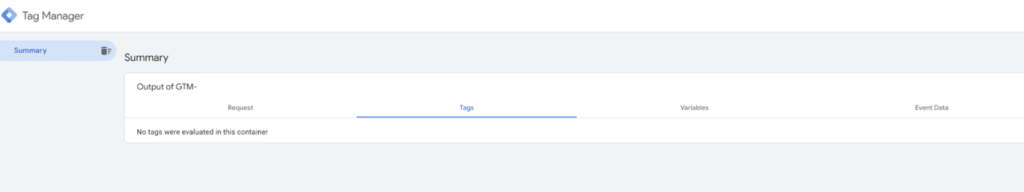
Tags
The tags tab also works like you would expect compared to client side GTM. It shows which tags fired for the event, it can be several. For example the view_item event from client side might trigger one GA4 Tag and one Floodlight Tag, sending off different requests to the different tools, but still based on the same event data.

Tags. Source: GTM
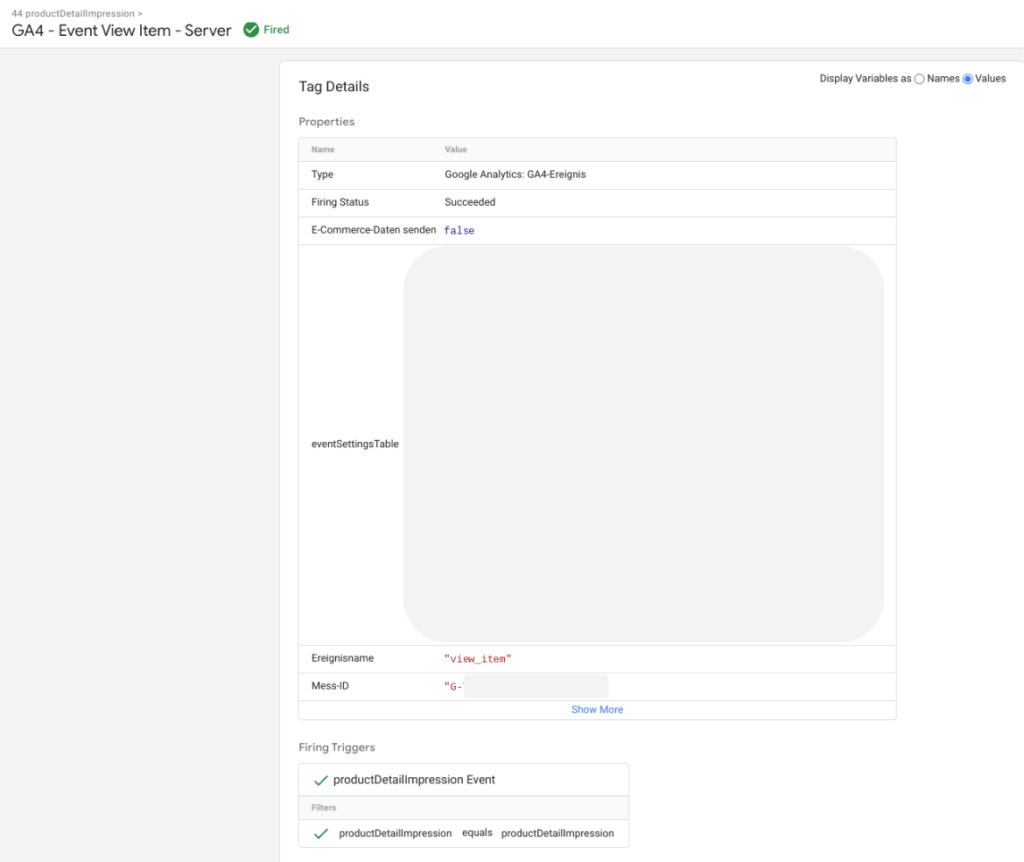
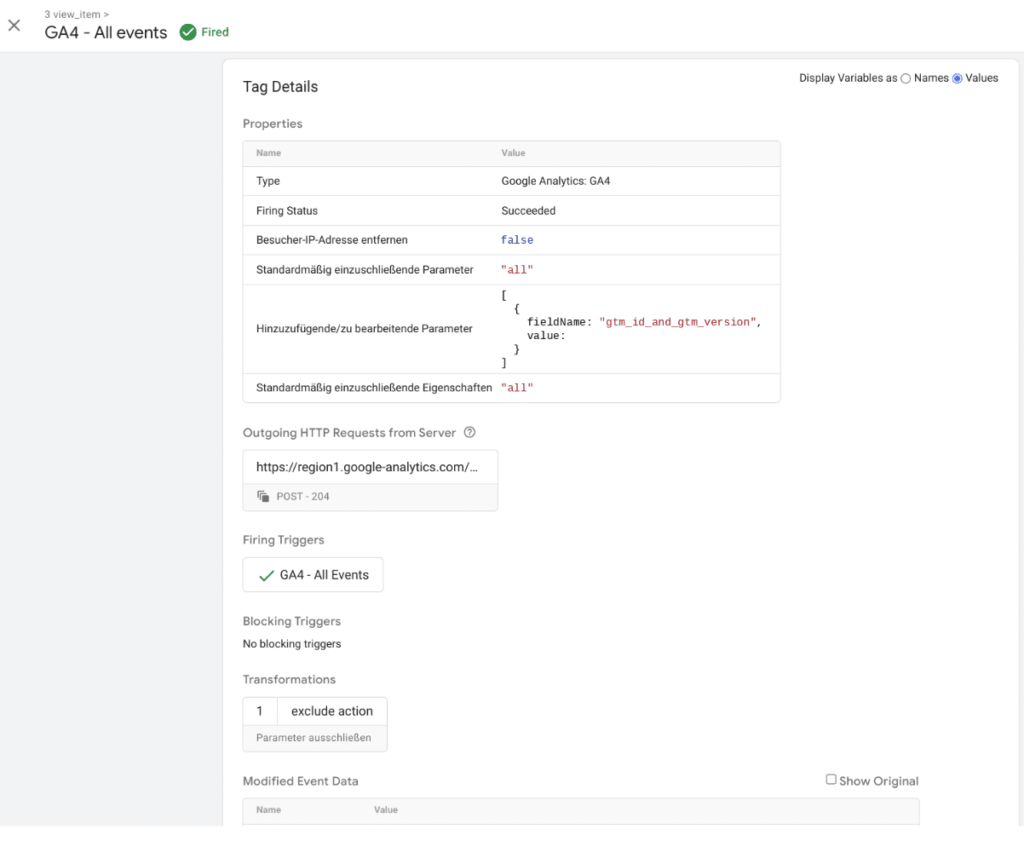
Modified event data
If you open up one of the tags, you will see some more information about the tag when it fired. You will, just like on the client side, see which trigger made it fire and or blocked it.
A new feature in server side however, is the transformations. A transformation is a set of rules for which event data that came into the server side container the tag in question is allowed to use. For example the same client side event might be used for both GA4 and Floodlights. But some of the event data is excluded from the Floodlight but used in GA4.
In this case I used a transformation to exclude the event parameter “action” from the event data for this specific tag. It will not be processed and sent on to GA4.
Modified event data. Source: GTM
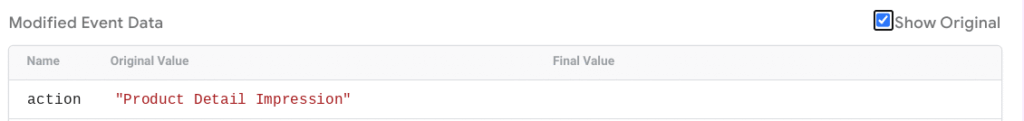
If you click the checkbox to “show original” you will get a side by side comparison of which data is available on the event and what data this tag is allowed to process.
Here we can see that the action parameter is no longer included:
Show original. Source: GTM
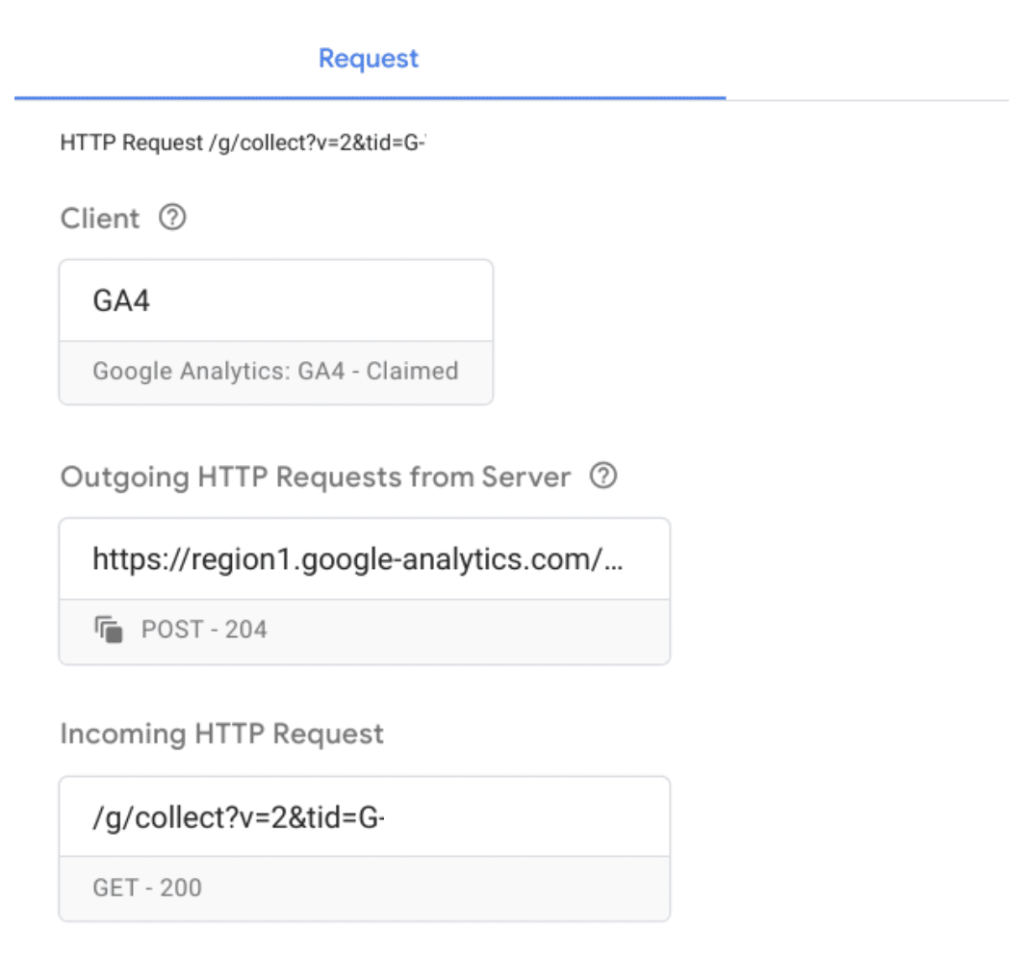
Request
The last tab is the request tab. Here we can see more technical information about the client, the outgoing request and the incoming request. This is a little different from what you might be used to in the client side container.
Request. Source: GTM
Client
The client is a server side specific feature. There can be several clients in the container but only one client is allowed to process each incoming request.
Incoming request
This is the information that is coming into the server side container that can then be processed. In this case it is the same GA4 event that was sent from the client side container. For normal debugging it is easier to look at the event data tab. But if you want to know look up some technical details or how the request looked before it was processed, you can look here.
Outgoing requests
In the example there is only one, but there could be several. These are mainly the result of the tags that you see fire in the Tags tab. In the example we see the request that the GA4 tag made of the incoming request and the rules set in the transformations. It is this information that will be sent off to GA4. This is the equivalent of the request that the client side tag would send directly to GA4 if there were no server side installed.
Endpoint
Check also that the events you test are received in the destination that you are sending them to. This could be the GA4 debug mode or the Pixel test page for your social tracking. A tip is to add a debug parameter with the server side container information to your requests. This way you can verify that the request really went through your server side container.
If the above is not working for you
In case the step by step workflow does not work out right, these are our recommendations for troubleshooting :
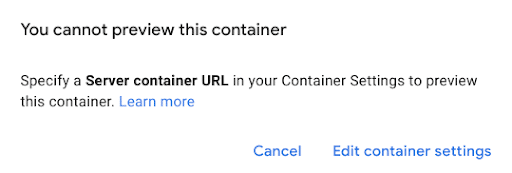
Cannot preview container
If you get this pop-up when trying to preview, you need to follow the link and add the url. This will only affect the preview abilities of your server side container. It is the url added to the client side tag that controls where the request will be sent.
Server side container. Source: GTM
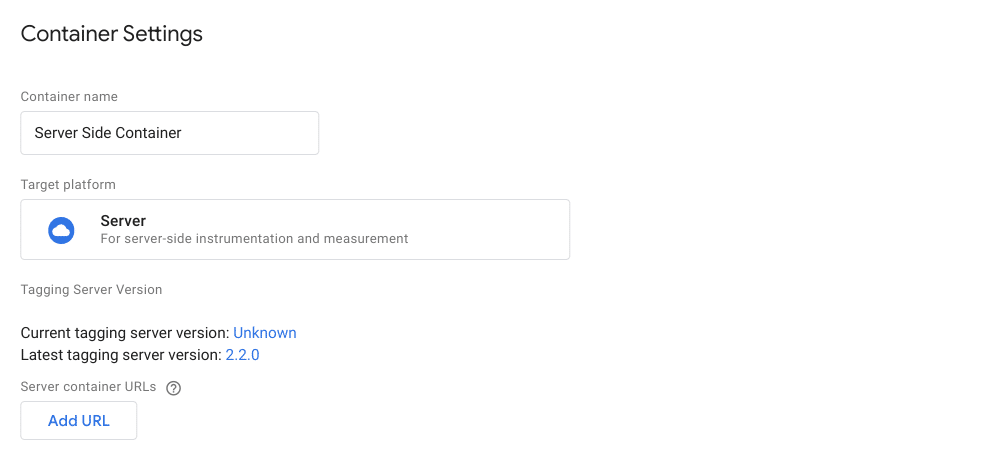
Container settings. Source: GTM
An event is not showing up in server side preview mode
Here are suggestions of some things you can check if you do not see the event in the server side container.
Check that the tag fired client side.
Just like you would normally for client side tags.
In tag details, verify that the server_container_url is the correct one.
It should match with the url in the preview settings (see above) and the url where the server side container is set up.
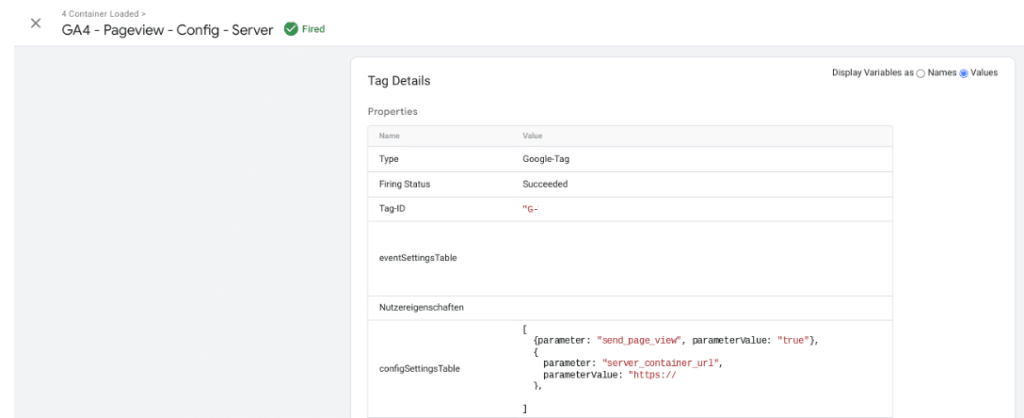
Server container url. Source: GTM
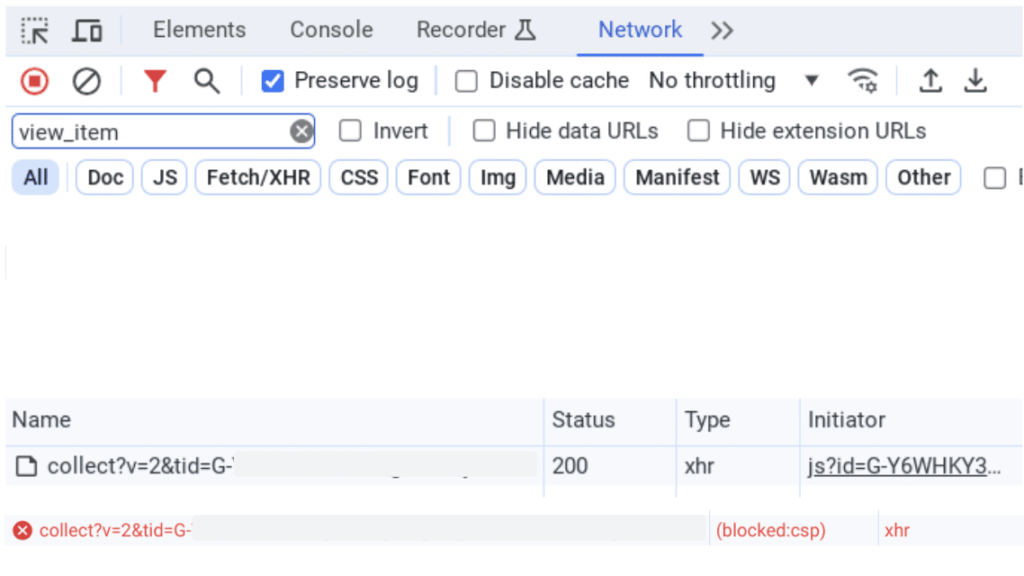
Content Security Policy, check if the request gets blocked by it.
Go to the browser developer tools (F12 or right click and then choose “Inspect”). In the Network tab, filter on the event you want to examine.
To see all GA4 requests you can filter on collect?v=2. If you want to only see a certain measurement id, you can filter on tid=G-XXXXXX (replace G-XXXXXX with your measurement id). Or you can filter on the GA4 event name, for example view_item.
In the example below, the request with status 200 was successful while the request with the blocked status was not. Check in the Console tab for an error message with more information of what exactly was blocked.
Network tab. Source: Chrome developer tools
Conclusion
Debugging a server side tracking set up in GTM follows the same patterns as you are used to with client side tracking. Once you know where to look, it is actually easy to follow your request as it moves from the browser to the client side container, on to the server side container and then sets off to the end destination.