BigQuery Cost Management and Monitoring

Management Summary
In a world of growing data, managing and monitoring data storage and query costs becomes more crucial than ever. Luckily BigQuery offers multiple ways for cost management and monitoring.
BigQuery Jobs explorer
Managing BigQuery costs doesn’t have to be a headache—GCP has built-in tools that make it easier. With features like BigQuery Jobs Explorer, Billing Export, and customizable dashboards, you can keep tabs on your spending, spot expensive queries, and even set alerts if things go over budget.
GCP offers out-of-the-box monitoring for most services. One which is especially useful is the BigQuery Jobs explorer tool.
Jobs explorer lists all BigQuery jobs within a specified timeframe and offers the option to order those jobs based on different criteria. Most probably the most useful criteria is “Bytes Processed”, this way big and therefore cost-intensive queries can be identified and optimized.
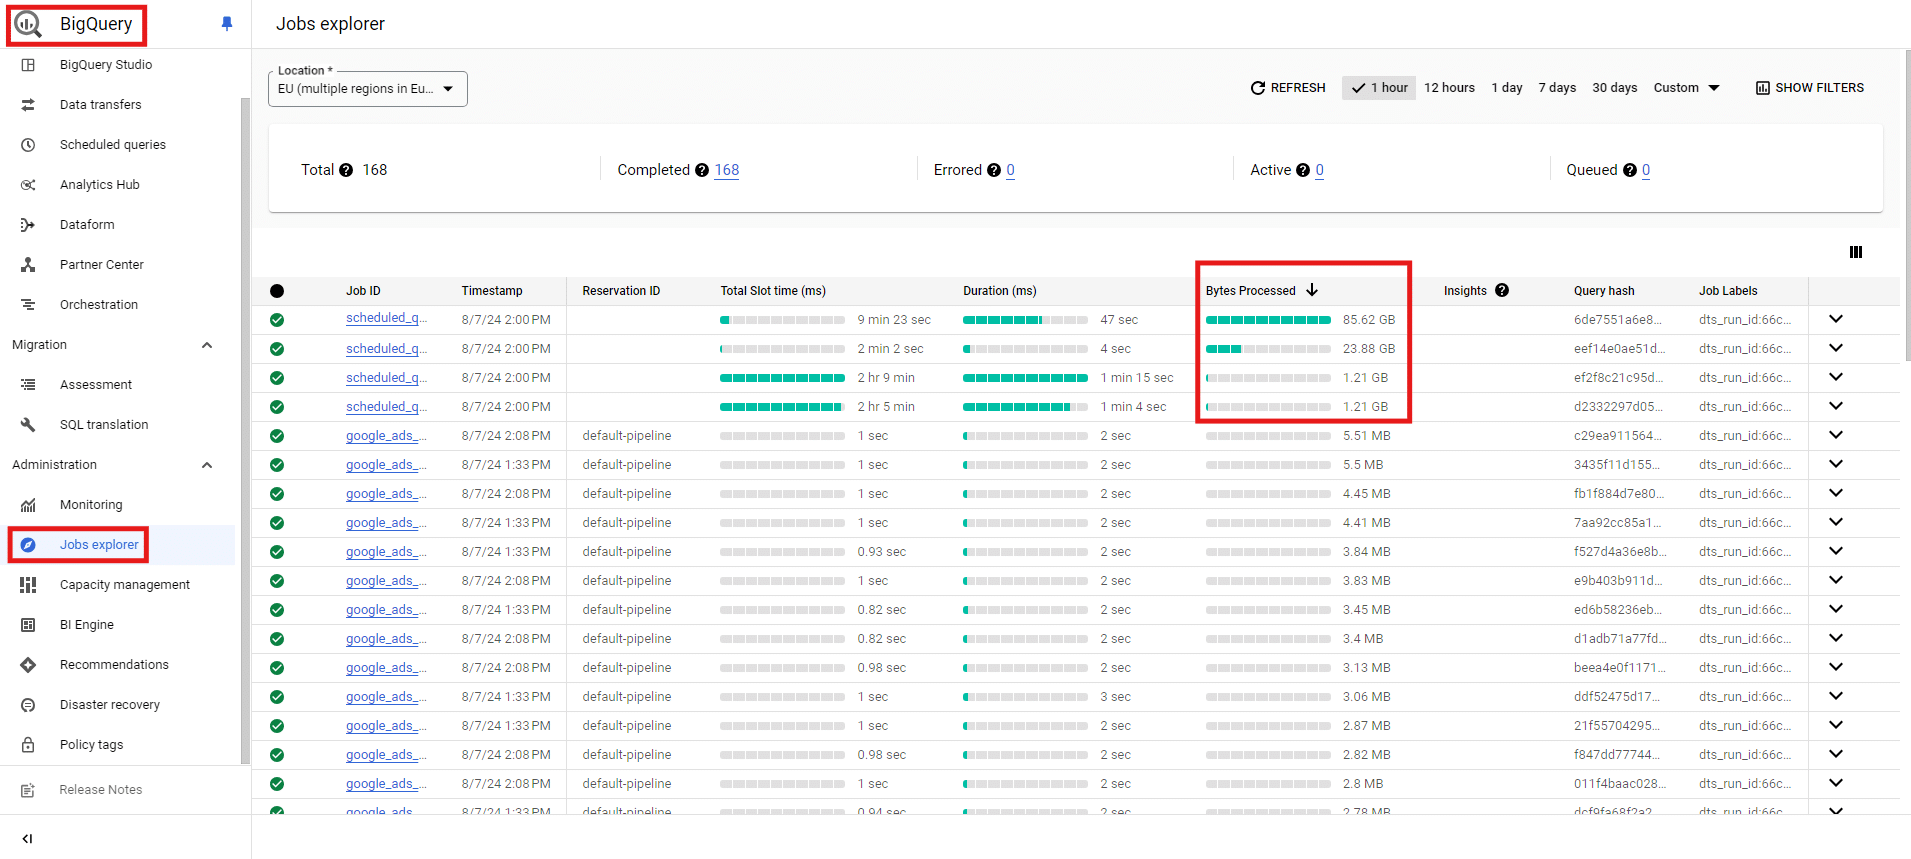
BigQuery Jobs Explorer “Bytes Processed”, Source: e-dialog
When selecting one of the jobs even more information can be examined. If the query was performed by a Looker Studio dashboard the “Labels” row will show the ID of the corresponding Looker Studio dashboard.

BigQuery Jobs Explorer “Labels”, Source: e-dialog
Advantages:
- No setup and configuration required
- Especially useful for identifying costly Looker Studio dashboards
Disadvantages:
- BigQuery costs are only indirectly identified via Bytes Processed
Billing export
The Google Cloud Platform (GCP) Billing Export feature allows users to export detailed billing data to a BigQuery dataset, enabling advanced analysis and reporting.
This feature provides comprehensive insights into cloud expenditures, helping organisations to track costs, optimize resources, and forecast budgets. It supports granular data export, including costs by project, service, and resource, which can be queried using SQL or visualized with tools like Data Studio.
The export consists of three different data which can be enabled separately:
- Standard usage cost
- Detailed usage cost
- Pricing
Advantages
- Detailed cost visibility
- Customizable reports and dashboards
- Enhanced cost management and forecasting
Disadvantages
- Requires setup and configuration
- Potentially complex for non-technical users
- Data latency can affect real-time analysis
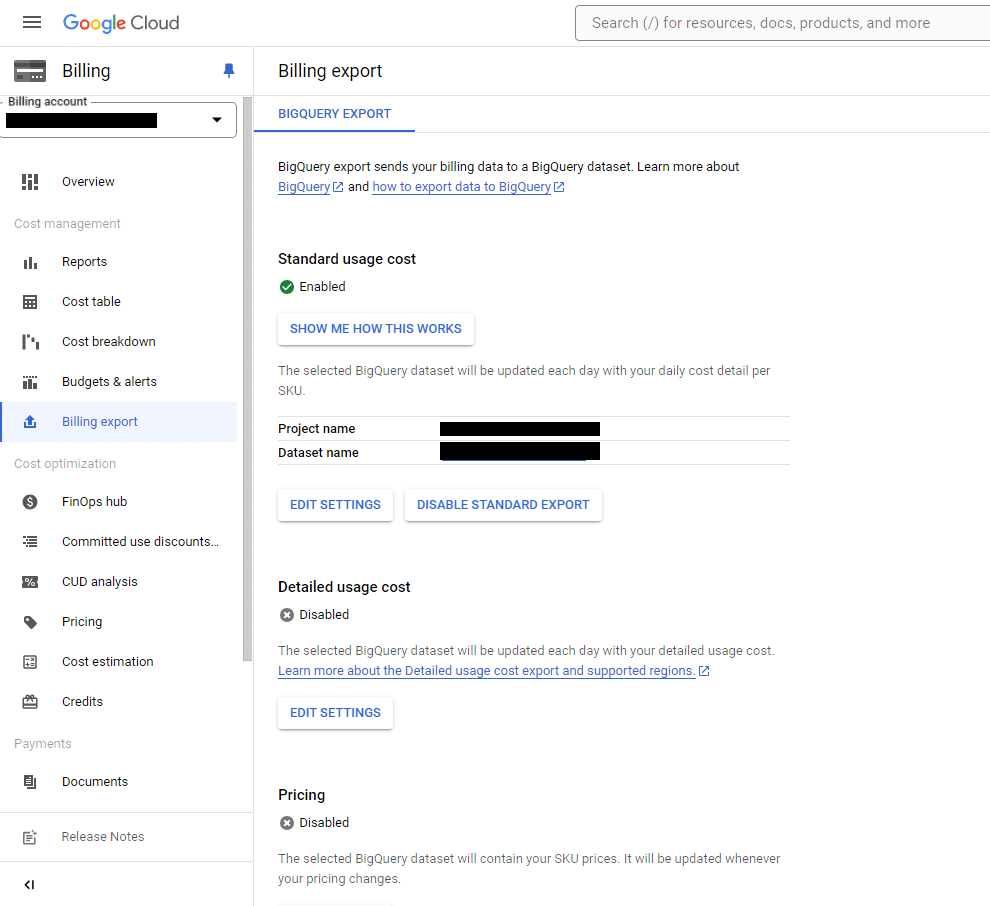
Billing export data, Source: e-dialog
Before the menu item “Billing export” you can find “Budgets & alerts”, which is a great way to define a budget threshold and get notifications via different channels.
Please keep in mind that:
- the tracking of the budget might be delayed by hours (or even days) and
- those thresholds are not a cap when exceeded, the used services will stop and no further costs are incurred, instead, you just get notified and costs continue to rise.
If you really want to cap your BigQuery usage resp. costs at a certain threshold you could instead use in addition “Quotas & System Limits”. This GCP feature allows you to adjust predefined quotas which comes in handy to secure e.g. against queries accidentally running infinite and blowing up BigQuery costs. This makes especially sense when knowing that some important BigQuery API quotas are unlimited by default.
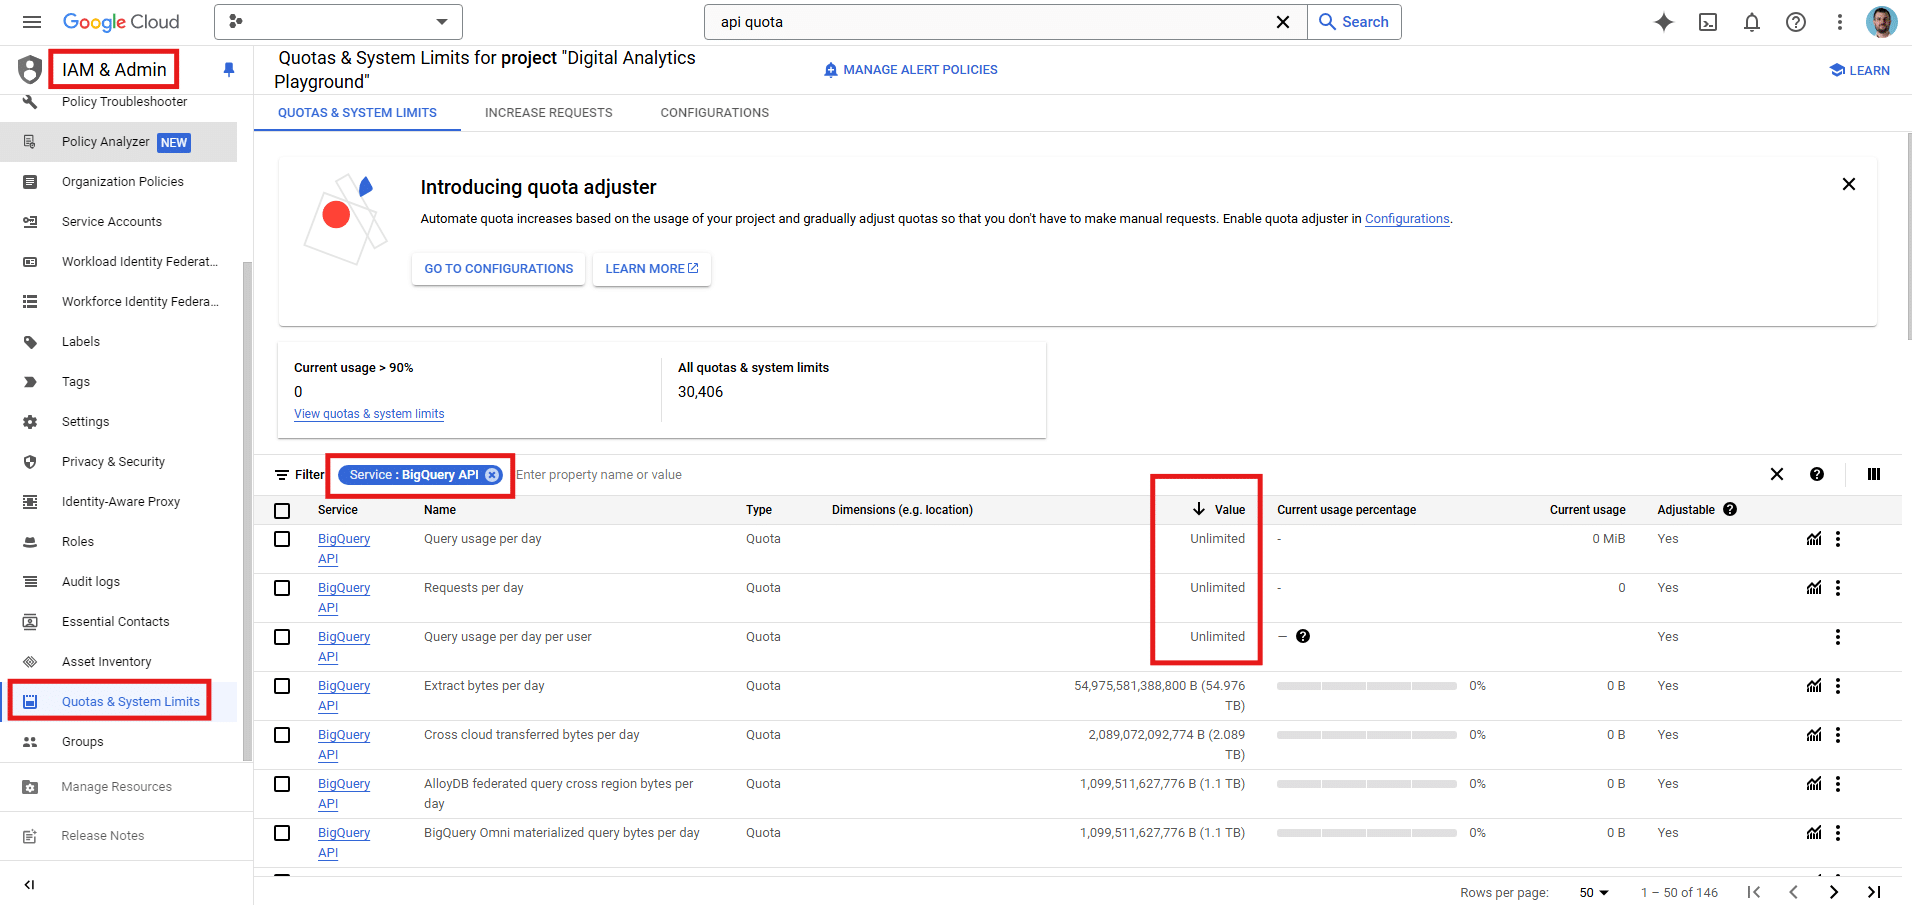
Quotas & System Limits, Source: e-dialog
Native GCP Monitoring dashboard
GCP provides native Monitoring dashboards for its cloud infrastructure. These dashboards provide real-time insights into the performance and health of your cloud resources.
The native dashboards are customizable and can be tailored to meet the specific needs of your organisation.
Especially useful to monitor BigQuery costs are metrics like:
- Stored bytes
- Table count
- Uploaded bytes
- Query execution count
- etc.
Advantages:
- Real-time monitoring available
- Alerts and notifications for threshold breaches
- Customizable dashboards for easy monitoring
- Integration with other GCP services, such as Cloud Logging
Disadvantages:
- Time needed to pick the right metrics and get to know the different filters and aggregation levels
- Does not directly show costs (you could create a calculation and calculate costs on your own via PromQL)
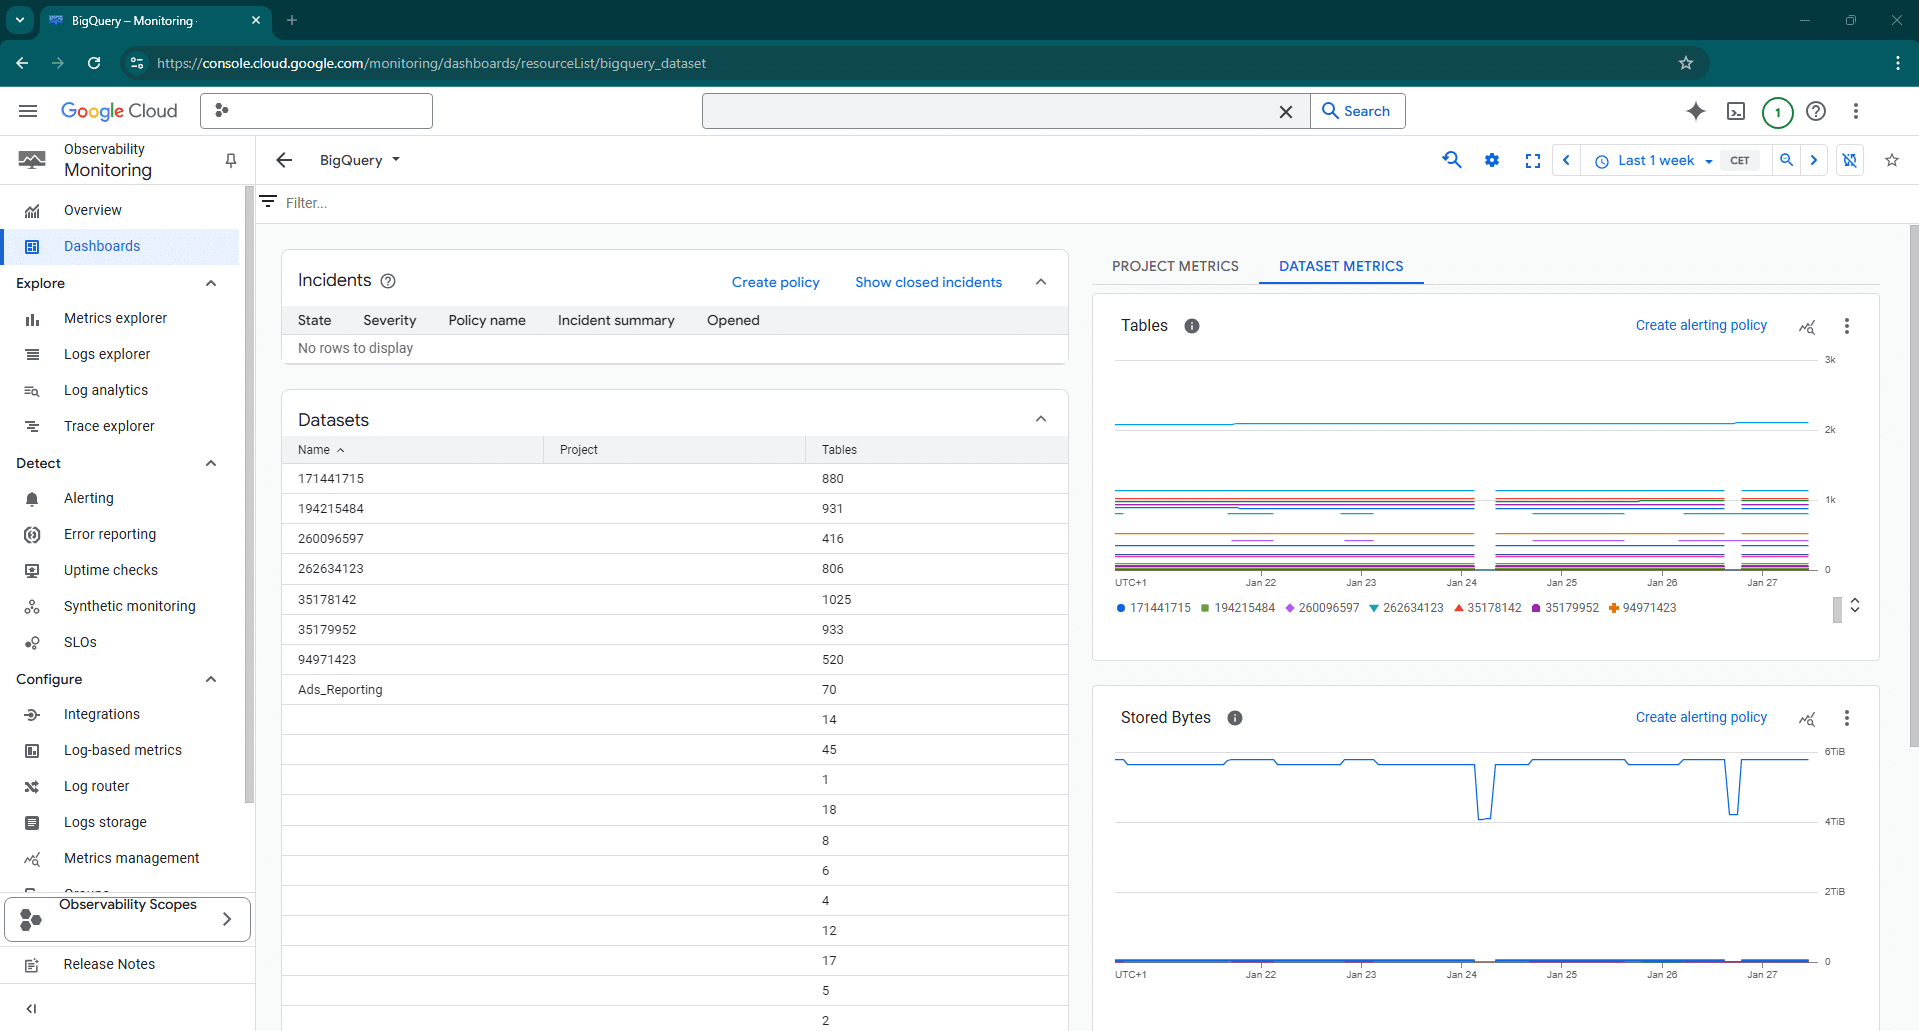
Native GCP Monitoring dashboard, Source: e-dialog
Custom Looker Studio dashboard
In addition to the native GCP Monitoring dashboards, also custom dashboards using Looker Studio can be created. Costs can either be calculated via a custom query or based on the BQ cost export.
Advantages:
- Customizable dashboards for easy monitoring
- Near real-time data integration with GCP services
- Advanced analytics and visualisation capabilities
- Collaboration and sharing features for easy sharing of dashboards
Disadvantages:
- Additional efforts needed
- Dashboard might create additional BQ costs
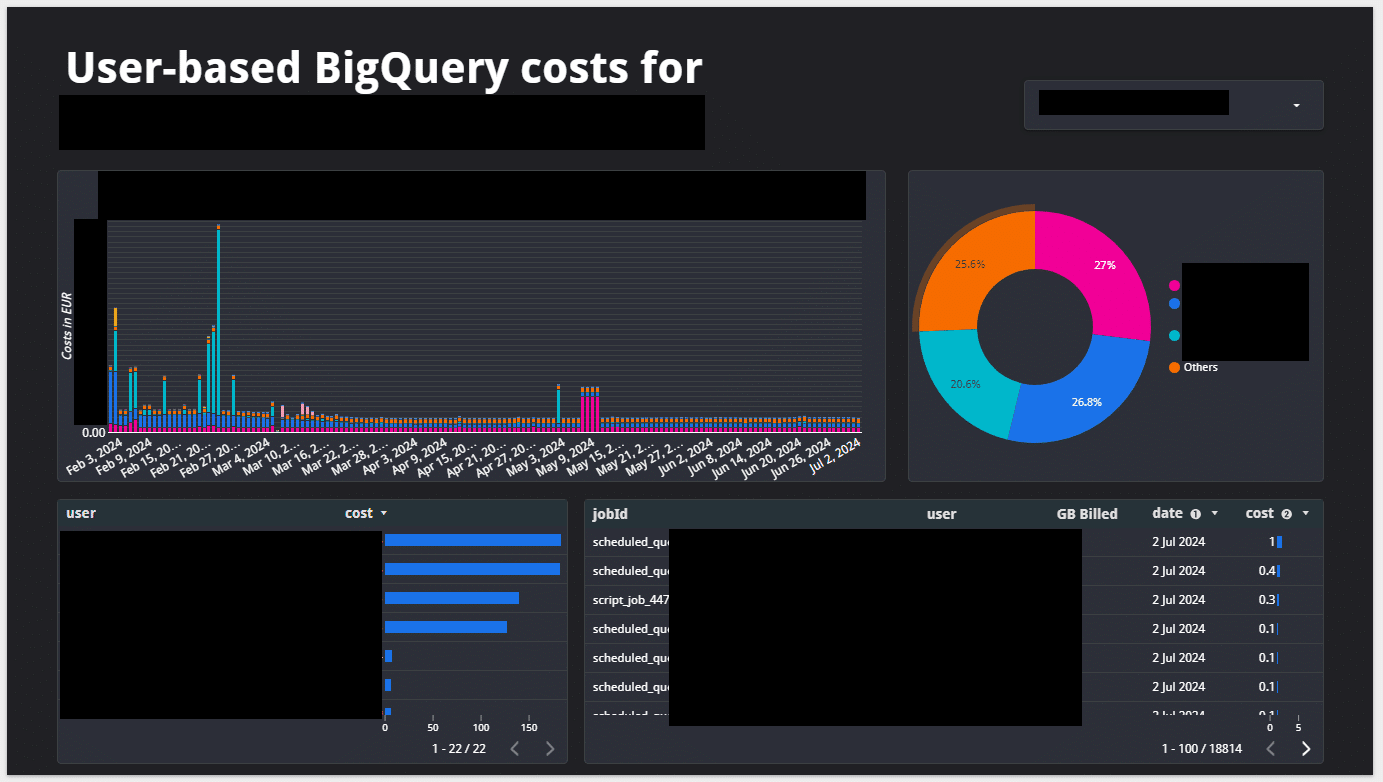
Custom Looker Studio dashboard, Source: e-dialog
Conclusion
Depending on the amount of stored and queried data BigQuery cost management and monitoring is needed. For quickly identifying costly queries the BigQuery Jobs explorer comes in handy.
The integrated Billing export allows comprehensive cost monitoring, but data latencies might occur.
If real time monitoring is needed GCP Monitoring and Looker Studio dashboards would be the perfect solution.