Advanced Analysis 8211 What Can The New Google Analytics 360 Feature
Management Summary
What can Advanced Analysis do?
Since May 2018, Google for Analytics 360 (formerly Google Analytics 360) has been offering customers the new feature for better display and analysisCustomer journey(currently available as BETA).
Advanced Analysis provides more detailed evaluation techniques and deeper exploration capabilities. This allows for a better assessment of how users interact with your website and enables the derivation of measures to improve the user experience.
In summary this means:Aggregate, Analyze, Act – aggregate data, discover insights and derive and implement measures! Advanced Analysis allows you to analyze AND activate your data WITH ONE CLICK!
How does the new Analytics 360 feature work?
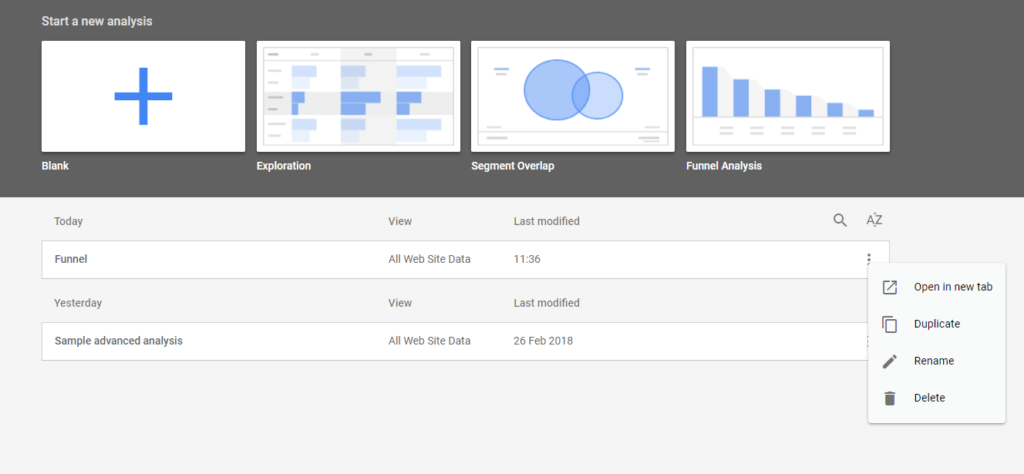
There is a new “Analysis” button at the bottom left of the screen in Analytics 360. When you click, a window with the Advanced Analysis homepage opens in the browser. The interface is similar to Google Data Studio’s design. From here, analyzes can be started and reports can be created.
What new options are there?
The three new techniques you can use to gain actionable insights into how users behave on your website are Exploration, Funnel Analysis, and Segment Overlap.
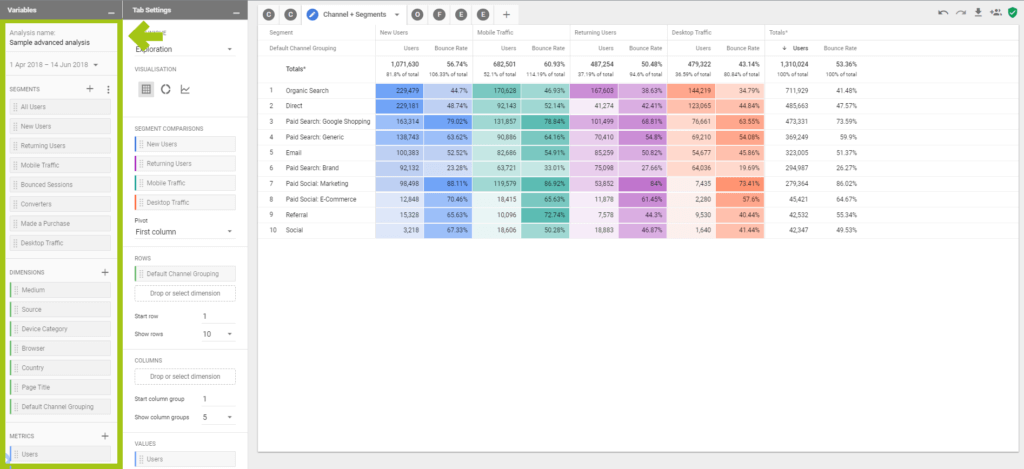
1. Exploration – Explore
With just a few clicks, detailed data analysis can be carried out using the exploration function. You can drag and drop segments, dimensions and metrics into the analysis area. The data is visualized simultaneously and multiple analysis tabs can even be displayed in a single view and compared directly.
Advantages:
- Drag and drop – segments, dimensions and metrics
- Instant visualization
- Compare multiple analysis tabs in a single view
- Test and refine insights – as you go
Practical example with the exploration technique
An e-commerce brand wants to know which promotional banners are clicked most frequently by which age group and gender and which promotions generate the most sales by age and gender.
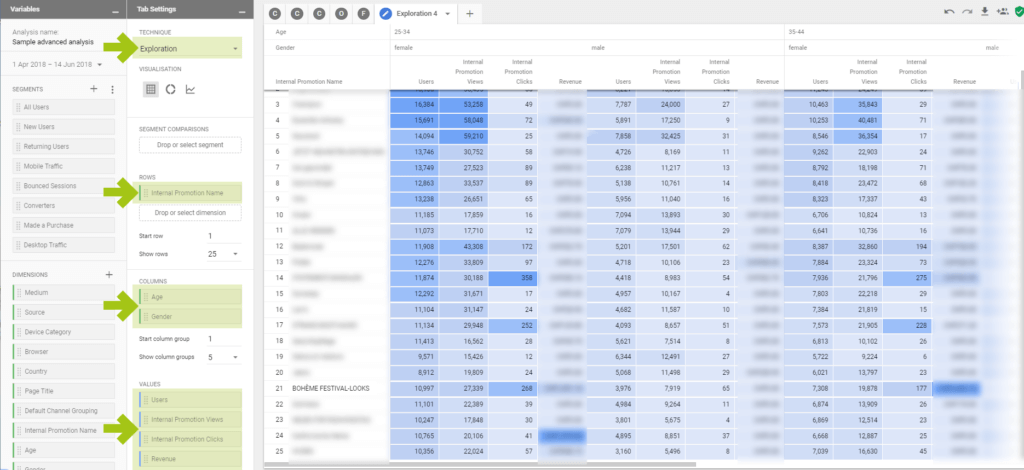
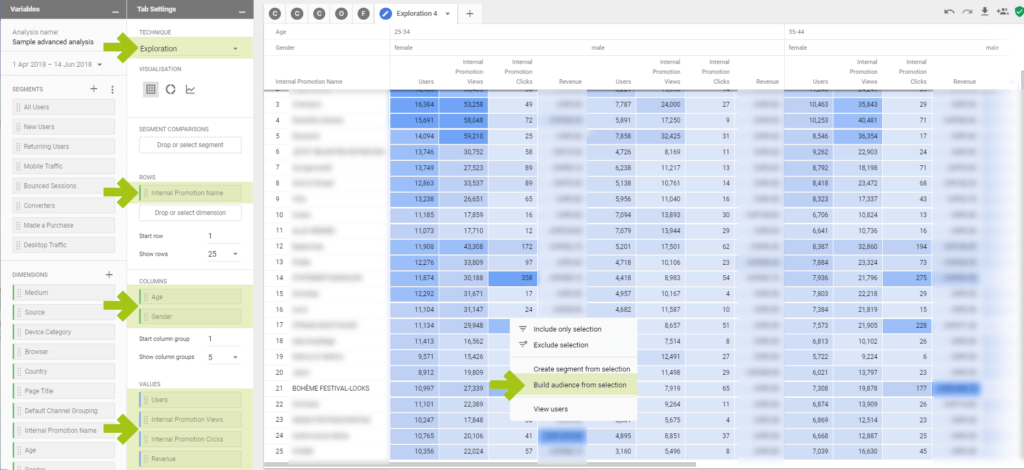
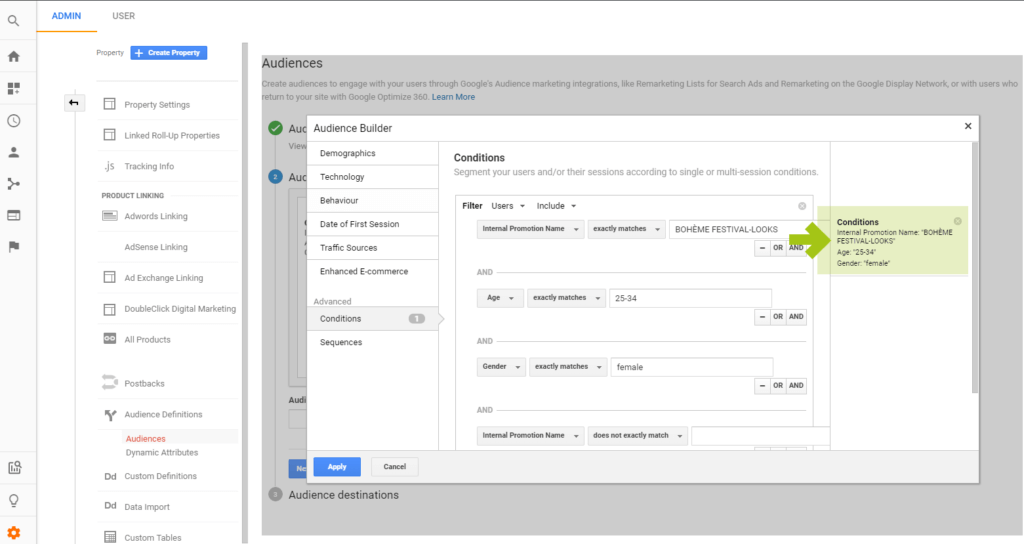
The Boheme Festival Looks promotion is particularly attractive to women between 25 and 44 years old. An important insight into the lifestyle of the target group for the brand! Customized targeting is now possible and users can be addressed in a personalized manner. This increases the relevance of the advertising message many times over, which in turn has a positive effect on campaign performance. This means that a new audience is created from this data with a right click (!) and used in Google Ads (formerly Google Adwords) for remarketing purposes!
2. Funnel Analysis – funnel analysis
With the funnel analysis, the purchasing process can be presented in order to identify potential for improvement. For example, you can quickly see how users go through your purchasing process and identify steps to improve it. Unlike funnel analysis in Analytics 360, which can display 5 funnel steps, advanced analysis offers up to 10 funnel steps and the ability to add segments and dimension splits. This gives you a deep insight into how different groups of people interact with your website.
Advantages:
- Visualization of user behavior in the purchasing process
- Recognize optimization potential
- Analyze funnels by segments
Practical example with funnel analysis
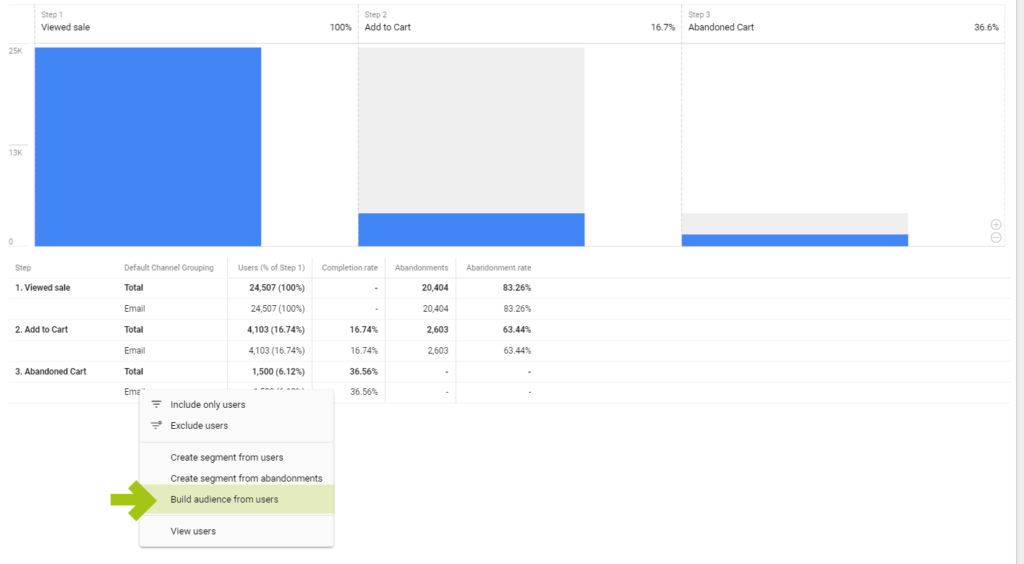
During the summer sales, the marketing manager of a retail brand wants to know how many usersSales pages visited, an articleadded to cartand theAbandoned shopping cart without purchasehave. Furthermore, these shouldsegmented by channelsbecome.Goal:Create an audience of shopping cart abandoners from a specific channel such as email marketing and bring them back to the website via retargeting.
This is how it works:
a. Create the funnel step “Have visited the sale page”.
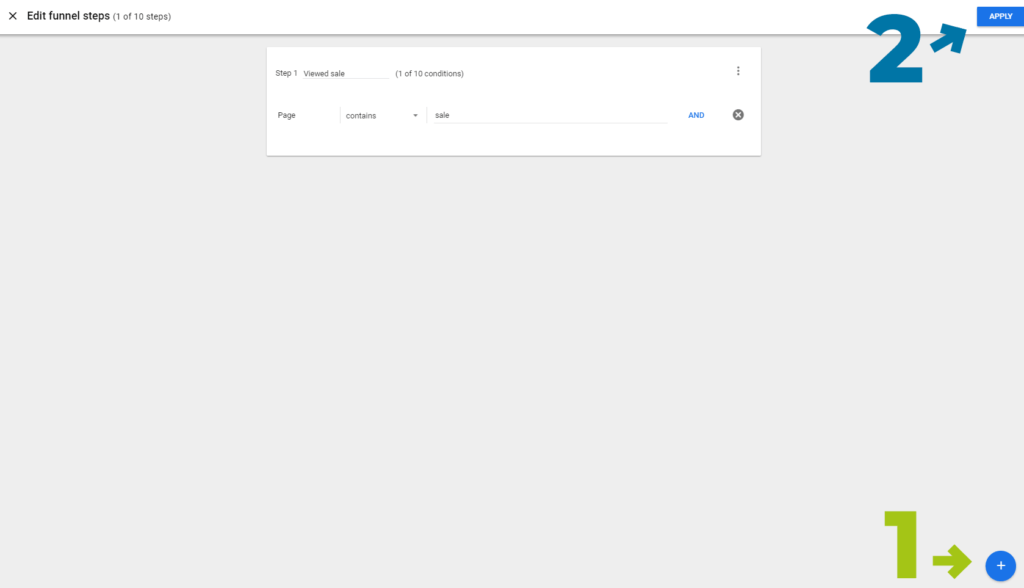
b. When you click “Select” a dropdown of dimensions or metrics appears
We filter by “Shopping Stage”
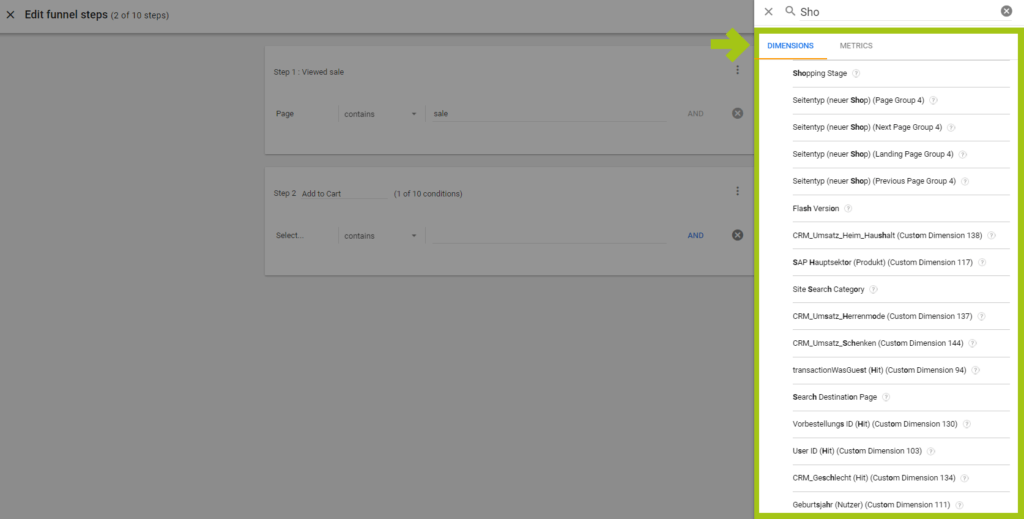
c. Create further funnel steps: put an item in the shopping cart and leave the shopping cart without completing the purchase

d. Channels – create breakdown
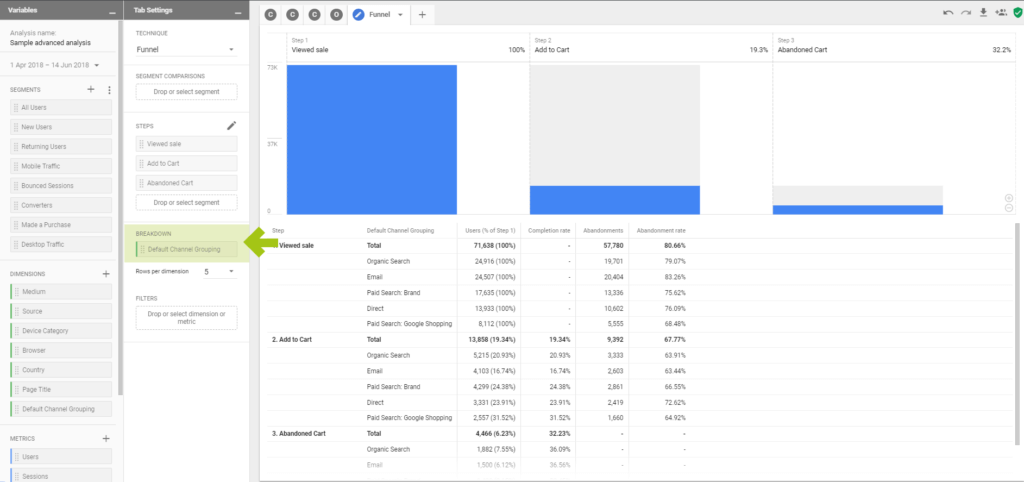
e. only filter shopping cart abandoners from the email channel
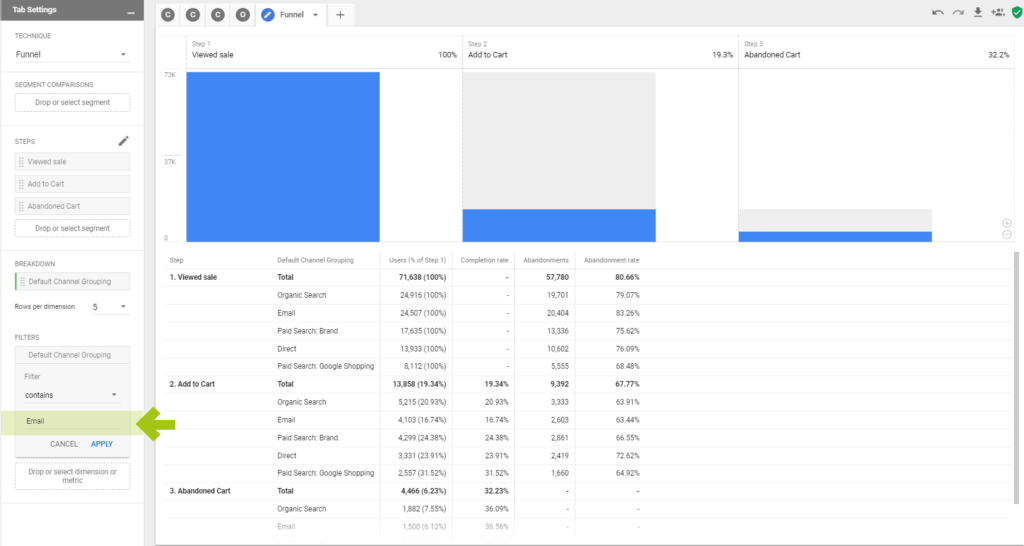
f. Create and activate shopping cart abandoners from the email channel as an audience
3. Segment Overlap – segment overlap
Segment overlap lets you see how segments you created in Analytics 360 overlap.
Advantages:
- Graphical representation of users in different segments and their overlap
- Identify segments that contain the same users
- Identify users who are in both segment A and segment B
- Overlap of up to 3 segments
Practical example with segment overlap
We at e-dialog are almost always looking for new talent. During job interviews, we like to see that applicants have at least looked at our blog once. We can quickly and clearly identify the question of how many users read our blog AND were on our job page in the segment overlap analysis area using the new visualization. Here it is now very easy to break down the segments and overlaps according to different dimensions and metrics. And here too: From analysis to activation of the audience with just one click.
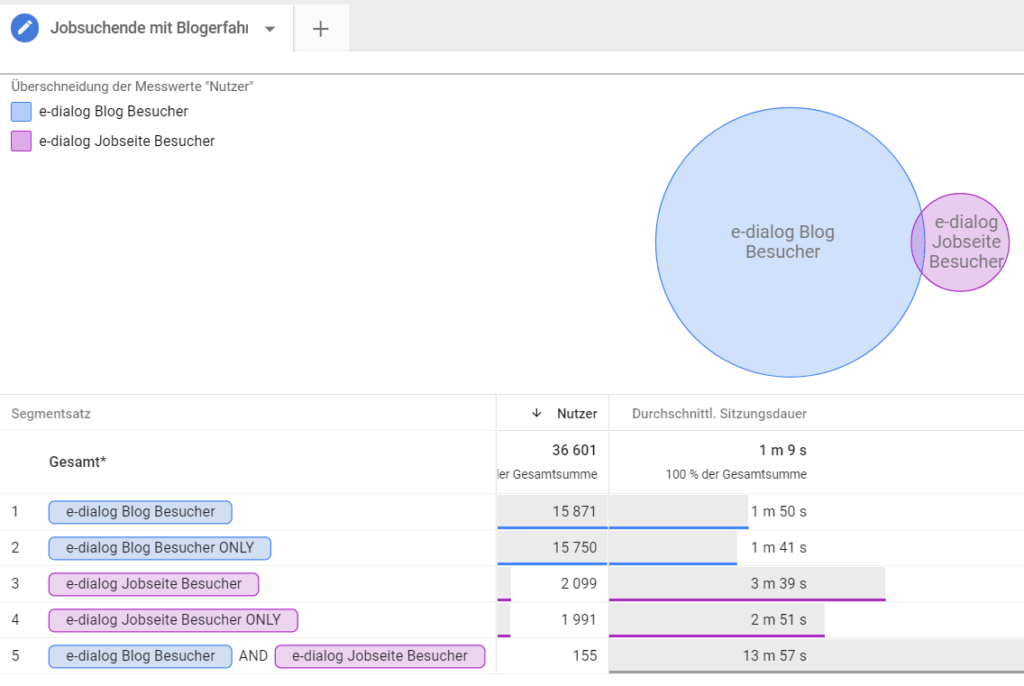
Now we can create and target an audience of super-engaged job prospects.
What can Advanced Analysis do better than current Google Analytics reporting?
The first thing you notice: thisDrag and drop interfacemakes operation and analysis very simple and user-friendly.
Furthermore, it canadvanced funnel analysisprovide deeper insights into how different groups of people interact with your website. Custom funnels with up to 10 steps and 4 segments are compared side by side.
TheSegment overlapenables iteasy and quickIdentify and use overlaps in up to 3 segments.
In addition to the new insights, these three new techniques offer a decisive advantage:
For the first time, you can create and use audiences directly from your analysis!
In summary: The advantages of Advanced Analysis
- User-friendly with drag and drop interface
- Facilitates analysis through smart data visualization
- Use 10 instead of 5 funnel steps for analysis
- Identify overlaps from up to 3 segments
- Create audiences easily and directly from the analytics
Advanced Analytics – Analytics Hub
- Own interface when you click on the Analysis menu item – opens the Advanced Analysis home page
- Styling similar to Google Data Studio
- Access to analytics
- Predefined layouts: Exploration, Segment Overlap or Funnel Analysis
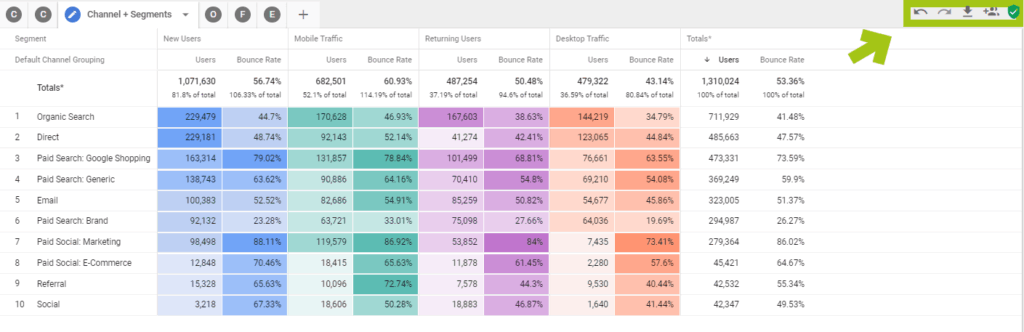
- Redo – Undo Buttons – Errors allowed
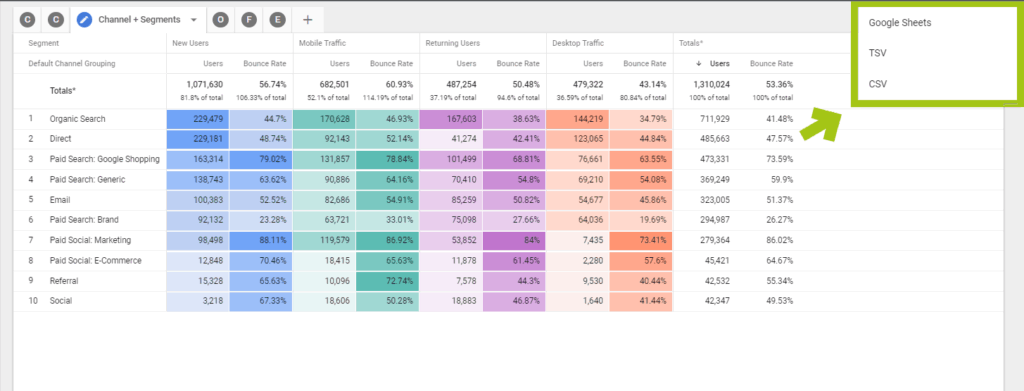
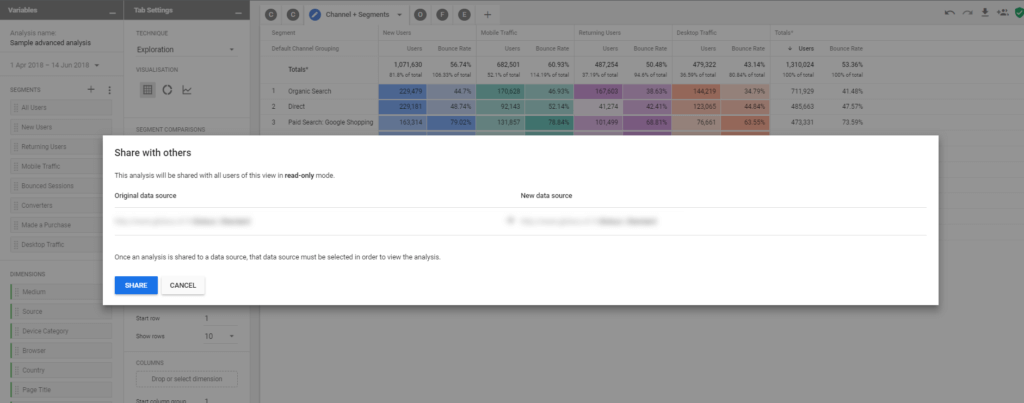
Data export and data sharing
The data can be exported as Google Sheets, TSV or CSV and the analyzes can be shared easily and practically.
Our conclusion
We love it!
- Complex analyzes “streamlined” – simple & fast!
- Graphical preparation of segments and user data
- Activate the data by right-clicking


