Anomaly Detection Ai Powered Features In Ga4

Management Summary
How can I identify anomalies using AI-powered analytics in GA4 and derive useful insights from them? We answer this question in this article.
Anomaly: what is it?
An anomaly refers to a deviation from a normal pattern or condition in the data – essentially an outlier. Such discrepancies can occur due to unexpected increases or decreases in metrics such as user numbers and transactions, or dimensions such as device categories on your site.
While the common goal is to avoid sudden drops, unexpected increases can also indicate problems with data collection or unforeseen events.
What does GA4 offer for anomaly detection?
Google Analytics 4 (GA4) brings numerous features that enable deeper analysis and in-depth insights into user interactions with your website or app. A particularly useful feature is theAnomaly detection. This AI-powered feature helps identify deviations and unusual patterns at an early stage. This means potential problems can be identified and resolved more quickly.
Anomaly detection in GA4
GA4 applies the statisticalProceedingsthe main component analysis for theAnomaly detectionto detect deviations for specific measurements or segments. This makes it possible to identify unusual patterns and react more quickly. The dimensions and metrics to be analyzed are first grouped into segments and normalized according to the number of users in a segment. If a segment exhibits anomalous behavior on a metric and includes at least 0.05% of the users in the property, it is considered an anomaly.
There are two main methods to view anomalies in GA4: TheInsights featurein the standard reports (you can find out more about this featurehere is a detailed oneBlog post) and Anomaly Detection in the Explorer reports.
Below we will focus on the second method:
Anomaly detection in the GA4 Explore area
You can find the Anomaly Detection feature inExplore area.This is how it works:
- Open the Explore section.
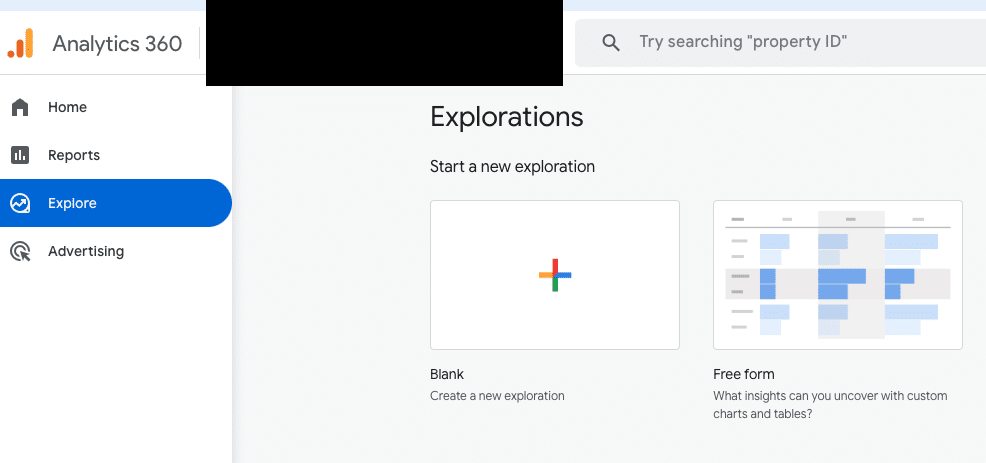
- Choose that oneFree form report.
- ChooseLine chartas a visualization type.
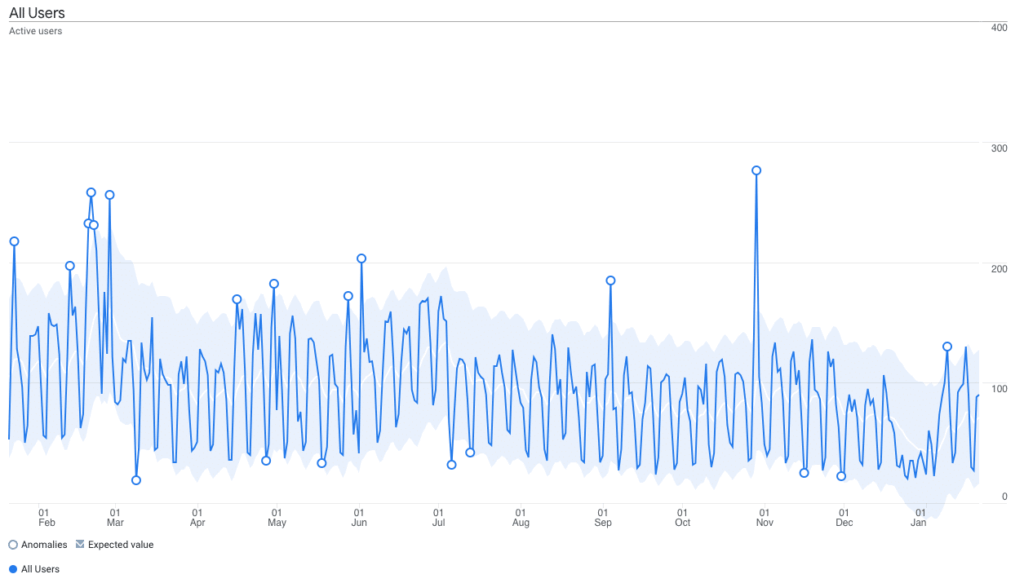 A line chart will now be displayed with all data from the selected metric, dimension and/or segments. With Anomaly Detection you can see outliers in your data directly in this line chart. This feature is enabled by default in the tab settings area, but can also be disabled using a toggle button if necessary.
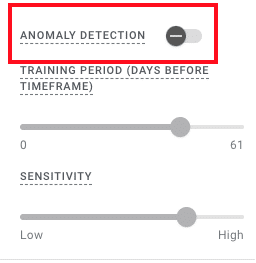 Anomalies are indicated by small white circles in the Explore report. When the feature is enabled, you can check whether the data shows unusual fluctuations and analyze them further. With a click or by hovering over one of these white circles, a dialog window opens showing the expected, actual and percentage changes in the data.
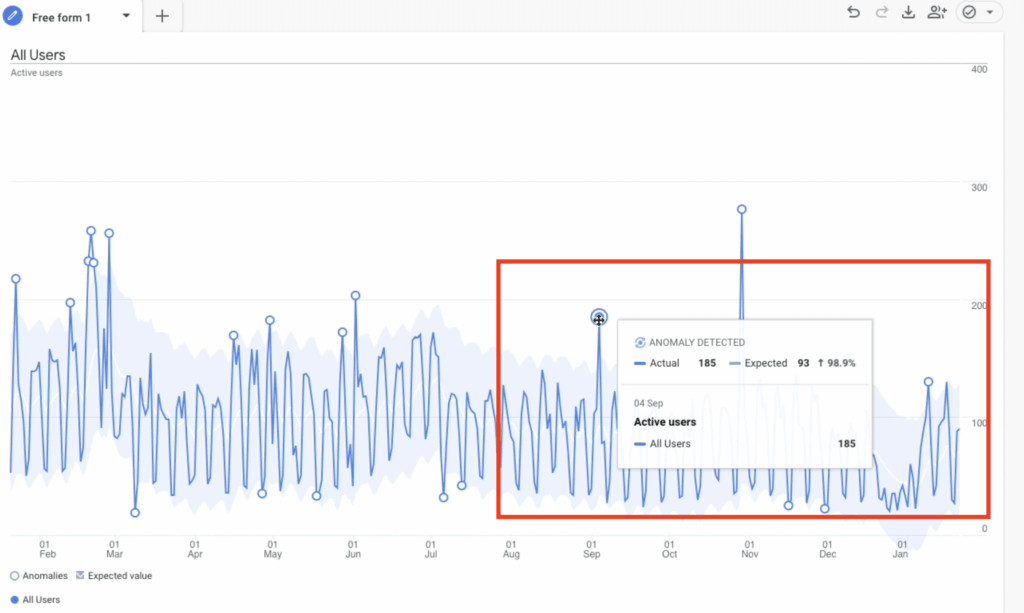 This information allows you to look at each anomaly in detail and decide whether a deeper analysis is required or whether it is an expected rash.
It often makes sense to initially use anomaly detection without breakdown dimensions in order to keep the overall overview. Without the additional breakdown, the data set remains clearer.
Breakdowns in Anomaly Detection
Once relevant anomalies are identified, or you see unusual changes in your data, a targeted breakdown dimension can be added to investigate the causes in more detail.
This can be particularly helpful for dimensions with few characteristics (e.g. device category), for example if only one value of a certain dimension is noticeable (e.g. mobile devices). For example, if traffic or conversion rates for mobile devices suddenly drop, this could indicate a possible technical issue for that device category. One theory you could explore would be to examine whether your site is optimized for mobile users or whether it has a responsive design so that it can be easily used by all device categories. Here, the breakdown dimension can be a helpful tool in anomaly detection to further investigate the abnormalities in your data.
View data in context
As useful as the AI-powered anomaly detection feature in GA4 is, it remains important to consider individual spikes in the context of relevant factors, such as holidays, special promotions or even incorrect traffic. This is the only way to make a well-founded assessment of the actual significance of the anomalies detected.
A typical example of an anomaly that is unlikely to have a negative impact on your data is theBlack Friday. On this day, a significant increase in sales or user activity can be expected. Since this increase is regular and predictable, we can consider it an exception and ignore the anomaly in the analysis.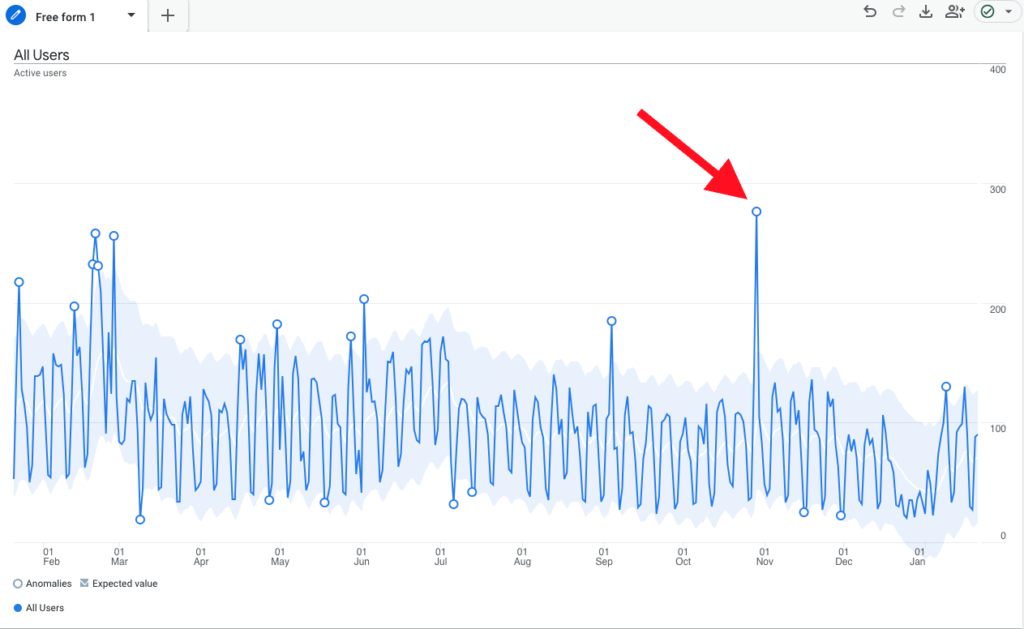
Settings for adjusting anomaly detection
In Explorer two canMain settingscan be customized:Training periodandSensitivity.
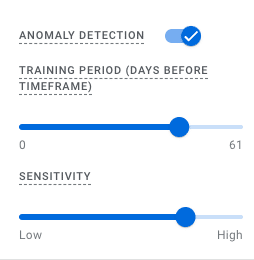
- Training period: Denotes the number of days prior to the selected time period that will be used to calculate the expected Anomaly Detection model based on the displayed metrics.
- Sensitivity: Determines at what point data is marked as an anomaly. Higher sensitivity leads to more anomalies detected.
A training period of is used to detect daily anomalies90 daysfromGooglerecommended, while for weekly anomalies a period of32 weeksis ideal.
Conclusion
Anomaly detection in GA4 is a powerful tool for detecting irregularities in the data and reacting more quickly. However, it is important to always consider the results in context and use meaningful breakdown dimensions in order to derive added value from the analysis. Anomaly detection in GA4 offers two main methods: via the Insights feature in the standard reports or via the Explorer reports. By adjusting the training period and sensitivity, the range of expected values can be influenced.
Whether an anomaly really provides a valuable insight depends on various factors: the context of the data, the granularity of the breakdown dimension used or the company’s goals. Not every rash is a problem – many rashes may be harmless. Nevertheless, anomaly detection in GA4 can be a valuable aid when analyzing your data, especially to identify and evaluate unexpected deviations at an early stage.


