Auction Data In Google Ads 8211 Competitor Comparison

Management Summary
In the previous blog article on the topic we agreeImpression shareand got to the bottom of the overall market. In this follow-up article, we will now take a look at the direct competitors in terms of the entered keywords with the help of Google Ads or Google Looker Studio (formerly Data Studio).
Auction data – a look at the competition
Auction data helps to analyze the placement of your own advertisements compared to the competition. Based on this, strategicKeyword, visibility, budget and bidding decisionsmeet. For example, if we see that the overlap with important competitors is very low, this may indicate that they hardly advertise on Google Ads, use a different keyword set or pursue other goals.
View auction data report in Google Ads
The auction dates(Auction Insights)are generally available in Google Ads for search and shopping campaigns. Using the example of search campaigns, these can be viewed on four levels. Firstly, at the account level across all search campaigns. If you look at this in more detail, you canCampaign, ad group or keyword levelbe used for this.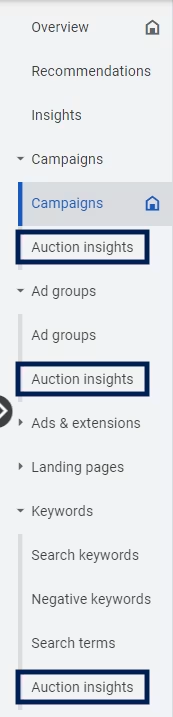 It is also possible to select individual keywords and retrieve the auction data for them. In the following example, two keywords have been highlighted.
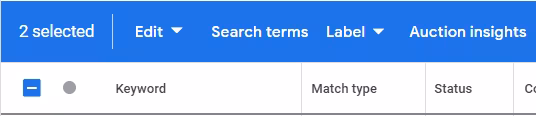
 Depending on the level of detail (account, campaign, ad group, keyword), the data displayed will of course differ due to the scope and of course also because the competitors’ setup rarely matches your own setup 1:1. TheThe number and names of the competitors listed depend on the selected observation period, the industry and the individual campaign setupand cannot be influenced by the advertiser himself. We see the aggregated data in the Google Ads interface. You will find out later how these can be clearly reported on a daily basis, for example.
Auction Data Report – all KPIs explained in detail
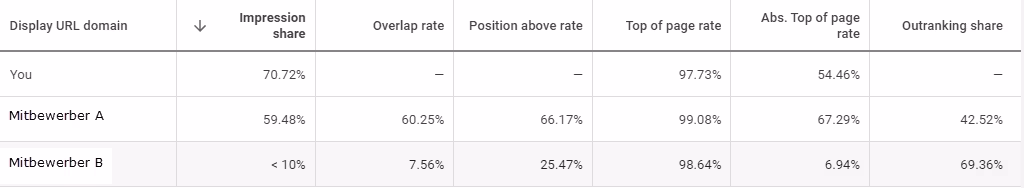
The auction data report explains – what is behind the six columns that Google provides us with at this point?
Share of possible impressions (Impression Share)
The metric provides information about the ratio of actual impressions to possible impressions. It helps with the initial assessment of whether the keywords are relevant, the bids and the budget are high enough. In the example above, competitor A has an impression share of approximately 60%, competitor B has less than 10%.
Overlap rate
The overlap rate indicates how often our advertisements and those of the respective competitor were placed after a successful auction process. At competitor A this was also around 60%, at B only 7-8%.
Position above rate
The ‘Rate of position above’ column shows how often competitors’ ads were shown before our own ads. The prerequisite is of course that everyone took part in the auction. Competitor A in particular is delivered around two thirds before our ads. Competitor B manages to rank ahead of us in 25% of shared impressions.
Top of page rate
This measurement provides information about how often your own ads or those of your competitor were shown above the organic posts. Since only a few competitors probably took part in the auctions in the example, all advertisements were almost exclusively shown above the organic results.
Rate for top position (Para. top of page rate)
Similar to the previous metric, this value indicates how often the ads were shown at the top of the search results page. Competitor A’s advertisements were shown in the very first position in a good two-thirds of the cases and were therefore extremely visible.
Share of possible impressions compared to competitors (outranking share)
In my opinion, one of the most interesting auction data values that Google makes available to us. The share of possible impressions compared to competitors shows how many cases our ads were shown before the competition or the competitors were not visible at all. Compared to competitor B, 70% of our own ads were shown above or without the competitor.
The previous example showed how auction data can be accessed and interpreted in the Google Ads interface using aggregated data. But is the auction data, for example, identical every day of the week, every week, every month or are there always new competitors or competitors who only run campaigns very selectively? These questions are very difficult to answer with the help of Google Ads and require a lot of manual work.
PRO TIP: Visualize auction data using Looker Studio
At this point, Google Looker Studio (formerly Datastudio) can help to prepare the data clearly. The following example shows a daily development for the last few months, where it is easy to see how visibility can vary greatly on individual days.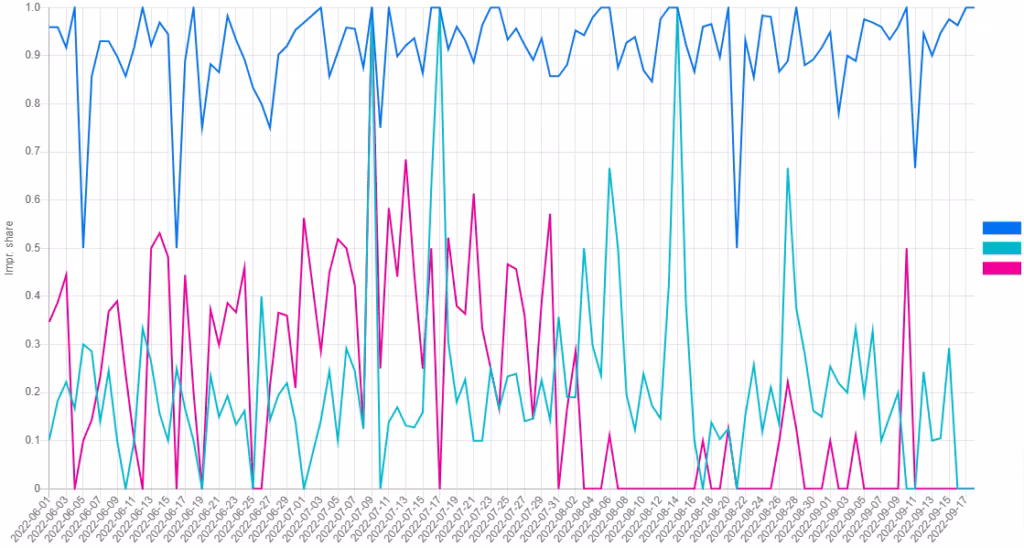
Conclusion:
If there are new competitors on the market or if they exert greater advertising pressure, this can certainly have an impact on your own KPIs (CPCs, budgets, CPAs, conv. rate, etc.). Therefore, auction data should never be ignored when analyzing and evaluating.
Would you like to find out more about auction data?


