Contentsquare & GA4: How qualitative and quantitative data together improve the user experience

Management Summary
The synergy of GA4 and Contentsquare: Quantitative and qualitative data for a comprehensive user experience
Data is the key to optimizing the user experience on websites and e-commerce products and is therefore an essential component in achieving your company’s goals. GA4 provides a powerful platform for quantitative analysis of user behavior. It primarily delivers data about the “what” of website visitors’ interactions and focuses on metrics such as pageviews, clicks, conversions, or bounce rates. The goal of GA4, for example, is to identify anomalies or trends in data early on and thus sustainably improve performance.
This is where Contentsquare (CSQ) complements GA4 as a digital experience analytics tool by providing qualitative insights into the “why” behind website visitors’ interactions. With CSQ, for example, you can uncover user intent, emotional triggers, or issues with the user experience (UX).
This article highlights how GA4 and CSQ complement each other perfectly to create an even more comprehensive picture of the user journey.
Google Analytics 4: Data for web & marketing analysis
Google Analytics 4 is an analytics tool characterized by its event-based data structure and AI-powered features, making it suitable for web & marketing analysis. It is primarily aimed at data analysts and marketing experts and focuses on data-driven marketing.

Contentsquare: Qualitative insights for experience optimization
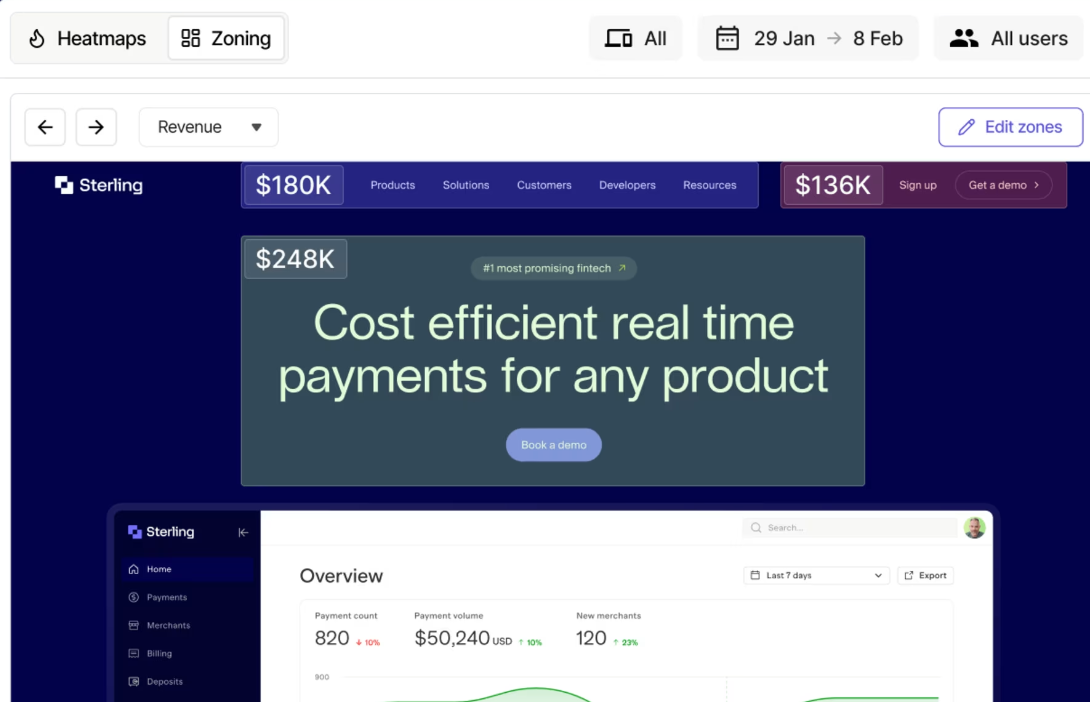
CSQ adds qualitative dimensions to classic web analytics. It is primarily aimed at UX and digital experience analysts. With features such as heatmaps, session replays, zone-based analyses, and UX score models, the tool provides detailed insights into user behavior and is designed for behavior-driven experience optimization.
Below, I present some of Contentsquare’s key features:
Heatmaps
Heatmaps visually show where users most frequently click, scroll, or move their mouse. This makes it easy to see at a glance which content is being noticed and which is being overlooked.
Session Replays
Session replays are anonymized session recordings that show individual user journeys. This can help uncover UX issues, for example by recording how users navigate through a page and when drop-offs occur.
Zone-based analyses
Zone-based analyses evaluate individual page elements such as images or buttons. If GA4 shows that a particular button is clicked less often than comparable buttons that lead to leads or purchases, CSQ can help determine in which context the element performs better or worse by analyzing the page elements.
UX Score
The UX Score is a feature that summarizes the user experience into a single value based on interaction data. This is helpful for quantifying the data and can be used for prioritization and comparisons across different pages or time periods.
Implementation via Google Tag Manager (GTM)
The basic CSQ setup can be implemented and maintained efficiently via Google Tag Manager. This simplifies the integration and maintenance of tracking and analytics tools. All tags are created in GTM with the appropriate triggers and can be centrally managed from there.
The integration is completed in a very short time in parallel with the GA4 setup in GTM, can therefore be easily maintained, and typically includes the following basic setup:
-
Main Tag (ID): Personally identifiable information (PII) can be easily excluded here via CSS selectors.
- Artificial Page View: For single-page applications (SPAs) or modals such as pop-ups.
- Custom Event Tags (e.g., addToCart): Specific events for Contentsquare.
CSQ and GA4 together: When should you use which tool?
Rather than replacing GA4, Contentsquare is positioned as a complementary tool. But when should you use which tool? The following comparison provides an overview:
| Tool | GA4 | Contentsquare |
|---|---|---|
| Primary focus | What users do (e.g., clicks, conversions, traffic volume) | Why users behave the way they do (e.g., frustration, hesitation, navigation patterns) |
| Data type | Structured event-based data (pageviews, transactions, metrics) | Behavior-based experience data (mouse movement, rage clicks, scrolls, replays) |
| Use cases | Marketing performance, attribution, funnel drop-offs | UX design optimization, session replays, analysis of friction points in the journey |
| Output style | Dashboards, KPIs, segments, statistical reports | Heatmaps, replays, journey maps, behavioral scores |
| Best suited for | Data-driven analysts & marketers | UX teams, product managers, designers |
Examples of how they work together:
- Identifying & explaining drop-offs: GA4 shows where users exit a funnel. Contentsquare can visualize whether users, for example, click on a non-functioning element or are confused by a cluttered layout.
- UX optimizations: CSQ helps you understand why a page performs better—for example, because it is more clearly structured or users notice the call to action more easily.
- Prioritizing optimizations: GA4 provides broad data coverage and helps you set priorities with CSQ. Which page elements are being ignored? Are certain elements such as buttons or forms not being reached? Which user groups show signs of frustration?
In short: CSQ cannot replace GA4, but as a complementary tool to GA4 it can provide deeper insight into user behavior and help you make decisions that are not purely numbers-based, but also take users’ qualitative experiences into account. This can be crucial for both UX and e-commerce.
Practical example: Optimizing the conversion rate in the cart process
Initial situation: An online shop uses anomaly detection in GA4 to determine that the conversion rate in the cart process is significantly lower on mobile devices than on desktop devices. Google Analytics 4 (GA4) offers anomaly detection as an AI-powered feature for identifying unusual patterns in your data; you can learn more about it in this blog article. However, the exact cause of this decline remains unclear.
Approach: Using CSQ to analyze user behavior, the session replay shows that on mobile devices an input field in the cart process is partially covered by the on-screen keyboard. This causes many users to abandon the purchase process.
Result: A simple adjustment in the front-end design—positioning the relevant input field so that it is no longer obscured by the on-screen keyboard—solves the problem. Within a week, we can see in the GA4 data that the conversion rate increased significantly on mobile devices, demonstrating the major benefit of using both tools together. The combination of GA4 and CSQ increases the likelihood that UX issues, for example, are identified more quickly. This interplay enables targeted optimization of the user experience.
Conclusion
The combination of GA4 and CSQ brings together quantitative and qualitative data sources to enable a comprehensive understanding of user behavior. At a time when user experience is a decisive factor for success on the web, it is advisable to consider both perspectives. Companies with complex customer journeys and high UX requirements benefit particularly from this integrated analysis, as it forms the basis for strategic decisions that are both data-driven and reflect users’ actual needs.


