GA4 Explore Reports: More Insights for Data-Driven Decisions

Management Summary
GA4 Explore Reports reveal what standard reports cannot—for more insights, better decisions, and data-driven optimization.
What Are Explore Reports in GA4?
With exploratory data analyses, Google Analytics 4 provides a particularly flexible analysis tool that significantly exceeds the capabilities of standard reports. It enables interactive, visual, and in-depth examination of website and app performance. Individual questions can be analyzed, specific users segmented, and their behavior examined in detail. Trends, anomalies, or irregularities can also be uncovered, as well as weaknesses in the funnel or user experience.
The use cases are broad, with Explore reports being particularly valuable for the following requirements:
- Ad-hoc and one-time queries
- Easy configuration and switching between techniques
- Sorting, restructuring, and breaking down data
- Using filters and segments
- Creating segments and audiences
- Collaborative exploration with other users of the same GA4 property
- Exporting exploration data for use in other tools
Through the targeted combination of segments, dimensions, and metrics, paired with the appropriate analysis technique, comprehensive Google Analytics 4 insights and optimization potential can be identified. This encompasses the entire process from initial interaction through decision-making to conversion and long-term customer retention.
How Do Explore Reports Differ from Standard Reports in GA4?
The strength of GA4 Exploration Reports lies in their practical applicability. They allow deep dives into data and identification of specific patterns or problems that cannot be revealed in standard reports:
| Exploratory Data Analyses | Standard Reports | |
|---|---|---|
| Flexibility | High flexibility in structure and customization | Limited flexibility – predefined layout |
| Visualizations | Diverse | Predefined |
| Analysis | In-depth, individual analyses | Overview, KPIs, and basic evaluation |
| Insights | Detailed user behavior and customer journey | Basic insights |
| Pattern Recognition | Patterns, correlations, causalities | Limited pattern recognition capability |
| Customizations | Ad-hoc queries, segmentation, filtering, sorting, technique configuration | Limited segmentation and filtering |
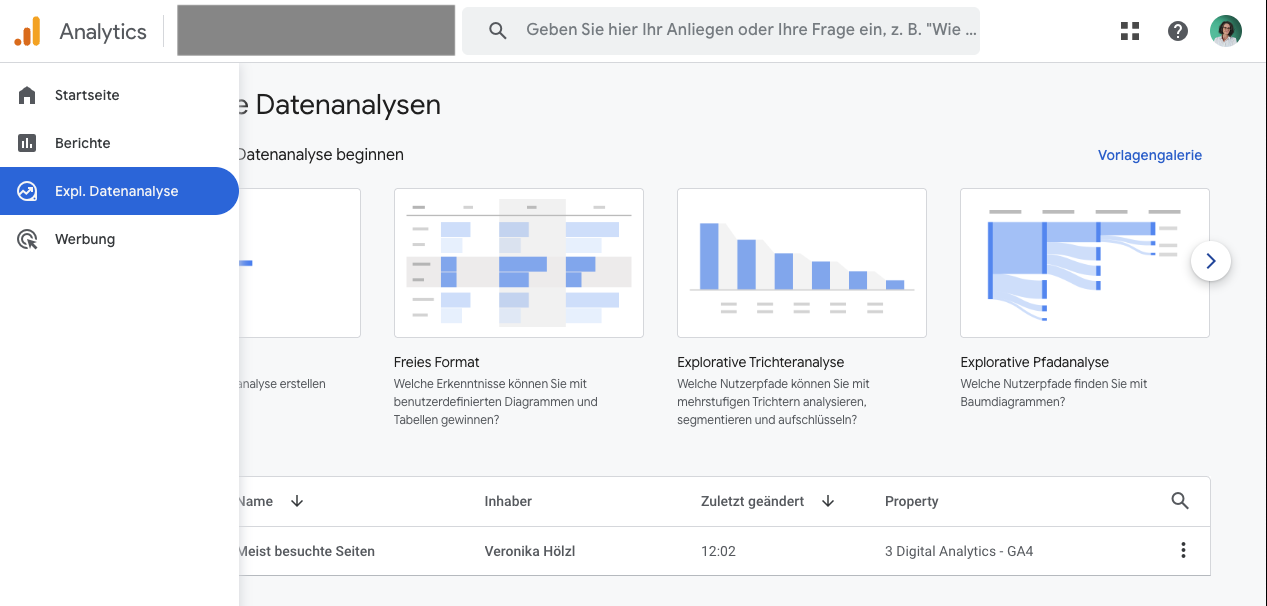
Where Can I Find Exploratory Data Analysis or Explore Reports in GA4?
To create Explore reports in Google Analytics 4, “Editor” permission for the Google Analytics 4 property is required. To share reports, “Administrator” permission is necessary to grant access to other users.
Exploratory data analysis can be found in the left menu under Explore:
How Is an Explore Report Structured?
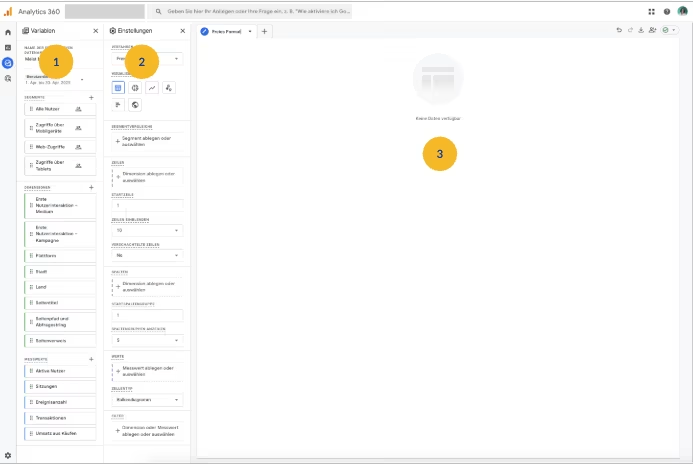
Exploratory data analysis consists of three main areas:
1 Variables (e.g., metrics, dimensions, segments)
2 Tab Settings (analysis structure)
3 Canvas (the actual visualization)
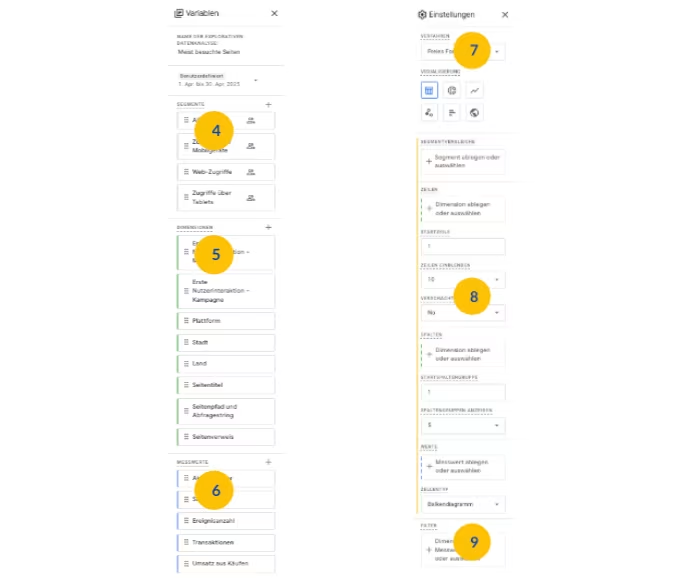
Variables
Here you can assign the report name, set the time period, and select and view the dimensions, metrics, and segments available for this exploratory data analysis.
4 Segments
Segments are subsets of users. They enable comparison of different groups, e.g., new vs. returning users or sessions from different countries.
5 Dimensions
Dimensions represent what is to be analyzed. Qualitative data such as page path, device type, country, event name.
6 Metrics
Metrics provide the numbers in exploratory data analysis. Quantitative data such as page views, sessions, engagement time.
Example of frequently used dimensions/metrics:
User source / Event count
Landing page / Conversion rate
Traffic channel / Engagement rate
Tab Settings
Here you can select the technique for exploratory data analysis and configure the currently displayed visualization.
7 Technique Selection
The technique can be selected here or the currently chosen analysis technique can be changed. For a Free Form technique, for example, visualization forms such as table, pie chart, or line chart can be selected. Not all techniques have multiple visualization options available.
8 Configuration Options
Depending on the selected technique, breakdowns, values, and additional configuration options are available. The settings made here enable customization of the exploratory data analysis.
Note on Limitations
The number of dimensions and metrics that can be added is limited: In Free Form, for example, a maximum of five dimensions in rows and two dimensions in columns can be added.
For more complex raw data analyses that require a higher number of dimensions, BigQuery offers an extensive alternative solution. This requires activation of the BigQuery export in GA4.
9 Filters
Here you can take measures to narrow the report to relevant data. Filters refine individual values (e.g., country = Germany). You can filter by dimensions, metrics, or both.
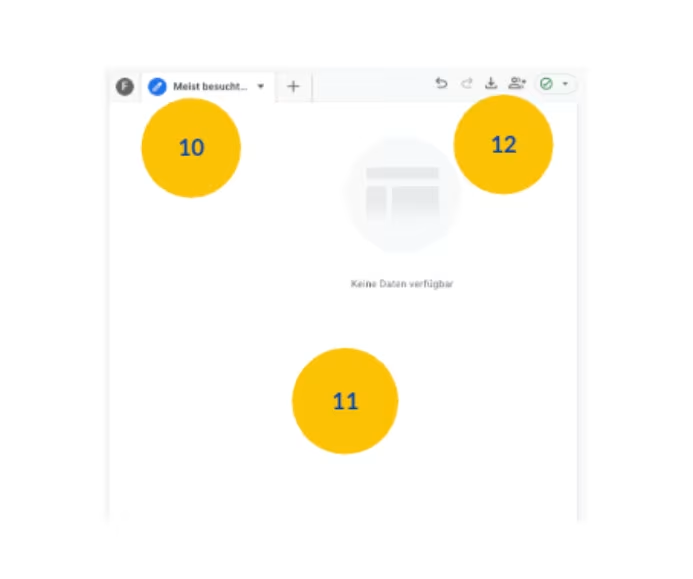
Canvas (the Actual Visualization)
10 Tabs
An exploratory data analysis can contain up to 10 tabs.
11 Visualization
Data is displayed according to the current tab settings.
Interaction with the data can occur, for example, by right-clicking on a data point in the visualization.
Toolbar
The toolbar allows you to undo and redo changes, export data, and retrieve additional information about the exploratory data analysis.
It also displays whether sampling was applied—that is, whether the displayed data is based on a sample or whether all available data was used. Sampling occurs when there is too much data for an analysis to be fully processed. In this case, a representative sample of the data is used to generate the results.
What Types of Explore Reports Are There?
An overview of available techniques:
Free Form
Free Form
Custom analyses—from simple tables to interactive charts.
Expand
Collapse
Free Form
What Is Free Form Analysis in GA4?
The Swiss Army knife of reports: Free Form analysis is the most versatile and flexible tool in Google Analytics 4’s exploratory data analyses. There is no predefined structure here. Instead, Free Form allows you to create your own tables and charts, combining dimensions, metrics, segments, and filters according to your own analysis goals or individual questions.
In addition to classic tables, donut, line, scatter, and bar charts as well as a geo map report can be created. Depending on the selected visualization, various settings can be configured.
Core Functions and Features:
- Individual Design: Tables and charts can be created according to specific needs.
- Diverse Visualization Options: In addition to tables, donut, line, scatter, and bar charts as well as a geo map report are possible.
- Flexible Data Combination: Dimensions, metrics, segments, and filters can be combined as desired.
- Interactive Analysis: Direct interaction with data within visualizations is possible.
Typical Use Cases:
- Listing top pages by engagement
- Determining conversion rate by source/medium
- Analyzing user behavior by device, location, campaign, etc.
- Detailed segment analyses
Answers Questions Such As:
- Which pages have the highest bounce rate on mobile devices?
- Which events most frequently lead to a conversion?
- How do users from different countries differ in behavior?
Free Form analysis is ideal for:
- Testing hypotheses.
- Quickly gaining an overview of specific behavior patterns.
- Examining complex data relationships.
- Answering individual questions that are not possible with standard reports.
Funnel Exploration
Funnel
Shows how many users complete individual steps to conversion/completion.
Expand
Collapse
Funnel Exploration
What Is Funnel Analysis in GA4?
Funnel analysis allows you to visualize and analyze the path users take through a specific process, such as a purchase process or registration. It helps with data-driven optimization of purchase processes, registrations, or better understanding user behavior.
Core Functions and Features:
- Visualization of the Conversion Funnel: Graphically displays the individual steps of the process and how many users complete each step.
- Identification of Critical Drop-off Points in the Conversion Process: Enables easy recognition of points where the majority of users leave the process.
- Conversion Rate Analysis: Calculates the conversion rate for each step and the entire funnel.
- Segmentation Options: Enables segmentation of users by various criteria to see how different groups behave in the funnel.
- Funnel Comparison: Creating and comparing different funnels is possible to determine which perform best.
Typical Use Cases:
- Optimizing the purchase process
- Improving registration forms
- Evaluating lead generation campaigns
- Analyzing onboarding processes
Answers Questions Such As:
- At which point in the purchase process do most users drop off?
- What is the conversion rate for each step in the registration form?
- Does the behavior of mobile users in the funnel differ from that of desktop users?
- Which marketing campaign leads to the most completed purchases?
Funnel analysis is ideal for:
- Identifying obstacles in the process flow.
- Measuring the effectiveness of different processes.
- Testing hypotheses and making data-driven optimization decisions.
- Better understanding the customer journey.
Path Exploration
Path Exploration
Illustrates how users move through the website or app.
Expand
Collapse
Path Exploration
What Is Path Analysis in GA4?
Path analyses are used to visualize and analyze the customer journey. Through detailed representation of the typical paths users take, bottlenecks and improvement potential can be identified. This ultimately helps to better understand user behavior and uncover potential problems in the user journey.
Core Functions and Features:
- Visualization of user paths: Graphically displays the most common user paths.
- Analysis of entry points: Makes visible where users typically arrive at the website or app.
- Identification of exit points: Recognizes where users leave the process.
- Analysis of loops and repetitions: Enables recognition of whether users visit certain pages or screens multiple times.
- Filter and segmentation options: Users can filter or segment paths according to specific criteria.
Typical Use Cases:
- Improving user experience (UX)
- Optimizing navigation
- Analyzing campaign impacts
- Troubleshooting
Answers Questions Such As:
- Which pages or screens are most frequently visited from the homepage?
- Where do users exit in the checkout process?
- How do users who arrive via a specific campaign move through the site?
- Are there unexpected or inefficient paths that users take?
Path analysis is ideal for:
- Understanding user behavior in detail.
- Identifying and resolving problems in the user journey.
- Evaluating the effectiveness of navigation and design.
- Testing and validating hypotheses about user behavior.
Behavioral Analyses
The following GA4 Explore reports are covered in a separate blog post. It’s worth a look, as they all help to better understand the behavior of individuals or groups on your own platforms.
Best Practices for Exploration Reports
To fully leverage the potential of Exploration Reports in GA4, it is recommended to follow some proven practices:
- Clear Nomenclature: Reports should be given meaningful, structured names—for example, by topic, goal, or time period. This helps teams maintain overview and easily find and assign reports.
- Consistent Segments: Defined segments should be used repeatedly and in a standardized manner. In GA4, segments can also be saved so they can be reused at any time. This ensures comparable analyses and minimizes inconsistencies in evaluation.
- Focus Instead of Overload: Limiting to one or two core questions per report increases clarity and reduces cognitive load during interpretation.
- Simple Start: Complex setups, especially at the beginning, should be avoided. Simple tables or visualizations are well-suited for getting familiar with the structure and possibilities.
- Avoid Misinterpretation: It is important to remember that correlation does not equal causation. Even when relationships become visible, this does not automatically mean a cause-and-effect relationship exists.
- Keep Sampling in Mind: With very large data volumes, GA4 may apply sampling. Attention should be paid to the indicator in the interface—otherwise results could be distorted.
Exporting and Sharing Exploration Reports
Exploratory data analyses are private by default. They are only visible to the person who created the report. Clicking “Share” makes the report visible to all users with access to the property (read-only access). Other users can now view the report but cannot edit it. To create their own editable version, the report must be duplicated.
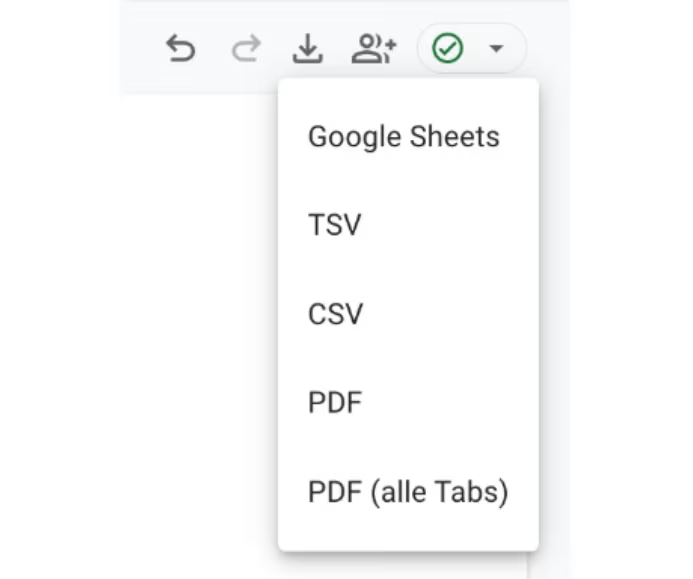
Export Options—External Sharing of Explore Reports
To share reports with stakeholders without GA4 access, exploratory data analyses can be exported as PDF, CSV, TSV, Google Sheets, or to the clipboard. These files can easily be shared via email, Slack, or in presentations.
- PDF: Ideal for presentations, management reports, or quick sharing within the team.
- Google Sheets / CSV / TSV: These formats are suitable for further analyses in spreadsheets. CSV (Comma-Separated Values) and TSV (Tab-Separated Values) enable data import into Excel, Google Sheets, or BI tools.
- Clipboard (in Explore): Enables quick copying of small data volumes for reuse in emails, documents, or tools like Slack or Notion.
Data Privacy & Retention in GA4 (Explore Reports)
Data Source: GA4 Property Remains the Foundation
Explore reports access the same raw data stored in the GA4 property. No additional data is collected or stored—they simply use already collected data in a more flexible presentation. This means:
- Data privacy rules, consents, and settings (e.g., cookie banner, Consent Mode, IP anonymization) also apply to Explore analyses.
- Their use is therefore not to be assessed “separately” from a data privacy perspective—it is based on existing GA4 configurations.
Data Retention & Access Duration
GA4 offers the following default data retention periods for event data and certain user data. These settings directly influence how long detailed data is available in Explore reports.
- Event Data:
- 2 months (standard for all properties)
- Optionally selectable:
- 14 months (GA4 Standard Property)
- 14, 26, 38, or 50 months (GA4 360 Property)
- User Data (e.g., User ID, user properties, cookies, advertising IDs):
- 2 months (standard for all properties)
- Optionally selectable:
- 14 months (GA4 360 Property)
- Demographic Data (age, gender, interests)
Regardless of the above settings, the maximum retention period for demographic data is always 2 months
After the set period expires, detailed exploratory analyses are no longer possible, as the underlying event and user data are deleted. Aggregated data may still be present in standard reports in some cases, but can no longer be used in Explore.
If compatible with data privacy requirements, it is recommended to set data retention to at least 14 months to allow for year-over-year comparison.
Tip: Long-Term Data Backup with BigQuery
For in-depth or long-term analyses that exceed GA4 data retention periods or Explore report limitations, as well as for complete backup of raw data, BigQuery export is the ideal solution.
Activation of export to BigQuery in GA4 should occur as early as possible! Data is only stored in BigQuery from the time of export. This ensures that historical data is preserved for comprehensive long-term analyses.
Conclusion
Exploratory data analyses in GA4 are a central tool for companies that want to gain a deep understanding of user behavior beyond standard metrics. They enable flexible, customized analyses, help test hypotheses, identify bottlenecks in the customer journey, and reveal optimization potential.
Through targeted combination of dimensions and metrics, segment formation, and visualizations, they support informed decisions and continuous performance improvement. A structured approach as well as knowledge of data retention and data privacy aspects are essential.
Explore reports show not only what happens, but also why it happens, thus paving the way for a data-driven and successful digital strategy.
However, it is important to note that Explore reports can reach their limits: when limits are reached, for example through complex queries or very large data volumes, BigQuery export becomes the only alternative for raw data access. BigQuery export is not only generally useful, but specifically important for non-GA4 360 properties to secure historical data long-term and analyze valuable insights beyond the set retention period.