GA4 Explore Reports: Understanding Behavioral Analysis

Management Summary
GA4 Explore Reports: Deep-dive into user behavior. Segments, cohorts, and lifetime analysis for targeted optimization of the customer journey. Maximize the value of your data in GA4!
The analysis of user behavior plays a central role in decision-making for digital business models. Standard reports in Google Analytics 4 (GA4) provide basic metrics but are often insufficient for identifying complex behavioral patterns or deriving targeted optimizations.
Exploratory Data Analysis in GA4
GA4 Explore Reports provide a powerful analysis tool. They enable customized evaluations that go beyond predefined standard reports. Through configurations, visualizations, and filter functions, specific questions—such as those regarding user behavior—can be examined more closely.
Explore report types for user behavior complement other exploratory data analyses in GA4 and provide targeted insights into event sequences, user paths, and return rates—at both the group and individual levels. Thanks to flexible visualizations, even complex relationships can be presented clearly and comprehensibly. This makes user behavior in GA4 fully analyzable.
Further advantages include:
- Adapting analysis to specific business questions
- Detailed segmentation and filtering
- Combining quantitative and qualitative behavioral data
Overview of available Explore report types in GA4 specifically for behavioral analysis
The following formats are particularly suitable for investigating user behavior and segment comparisons, supporting a targeted investigation of specific questions along the entire customer journey:

Segment Overlap GA4
Compares user groups and shows overlaps.
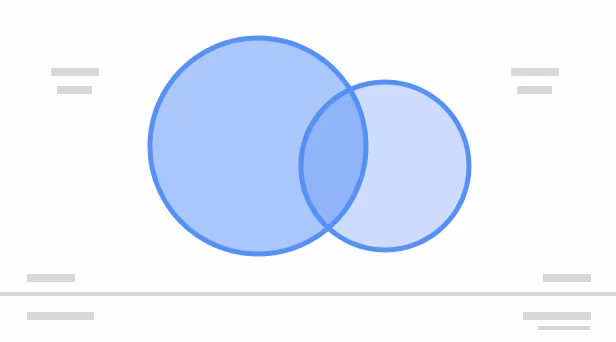
What is Segment Overlap analysis in GA4?
Segment overlap analysis is a method used to visualize which users belong to multiple segments simultaneously and/or to understand the relationships between different visitor groups. This can be used to optimize marketing strategies, create personalized experiences, and better achieve business goals. You can also find plenty of useful information about segments in the blog article Understanding Segments and Comparisons in GA4.
Core functions and features:
- Visualization of segment overlaps: Graphically displays how selected segments overlap.
- Comparison of up to three segments: Enables the simultaneous analysis of three different segments.
- Identification of shared users: See how many users are included in more than one segment.
- Analysis of overlapping segment behavior: Gain an understanding of how users who belong to multiple segments behave.
- Creation of new segments: New segments can be created based on the overlaps.
Typical use cases:
- Audience understanding
- Marketing campaign optimization
- Insights for product development
- Insights for personalization
Answers questions such as:
- How many users have both purchased a product and subscribed to the newsletter?
- Which users are both new and returning visitors?
- How many users have both downloaded the app and made an in-app purchase?
- Which users came via affiliate partners and made a purchase?
- Which users are interested in multiple product categories?
Segment overlap analysis is ideal for:
- Gaining a deeper understanding of your target audiences.
- Developing more targeted marketing strategies.
- Creating personalized experiences.
- Evaluating the effectiveness of campaigns and product features.
- Generating ideas for hypothesis creation.
User Explorer GA4
Track and analyze the activities of a specific user over a specific period of time.

What is User Explorer in GA4?
The User Explorer in GA4 is a tool that provides detailed information on the behavior of individual users on your website or app. It enables insights that often remain hidden in aggregated reports and helps to understand and optimize individual user experiences.
Core functions and features:
- Individual profiles: Displays a list of individual users with unique IDs.
- Detailed activity tracking: Shows the specific actions a user has performed on the website or app (e.g., page views, events, purchases).
- Timeline: Visualizes the sequence and timing of a user’s activities.
- Filter and search functions: Allows filtering and searching for specific users or activities.
Typical use cases:
- Troubleshooting
- Understanding individually chosen paths
- Customer service: Understanding interaction with support pages, targeted optimization of help pages, chatbots, or self-service offerings – reducing support efforts
- Fraud detection: Identifying suspicious behavioral patterns – detecting potential fraudulent activities early.
Answers questions such as:
- Which page did a specific person* visit?
- Which events did a specific person* trigger?
- When did a specific person* make a purchase?
- Were there any errors or problems that a specific person* experienced?
*Specific person:
User paths can be analyzed in User Explorer, but they are always anonymized. These are not identifiable individuals, but pseudonymized user IDs or device IDs – it is not possible to draw conclusions about real people.
User Explorer is ideal for:
- Gaining a deep understanding of the behavior of individual users.
- Investigating specific problems or questions from individual users.
- Analyzing and improving individual user experiences.
- Testing hypotheses about the behavior of individual users.
Cohort Exploration
Analyze long-term retention: When do users return, and how long do they remain active?
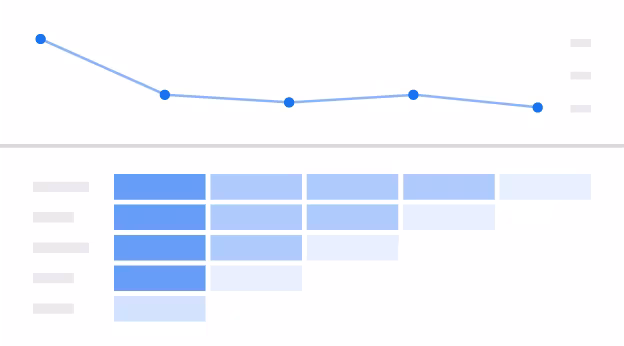
What is Cohort Exploration in GA4?
Cohort exploration in GA4 is used to analyze groups of users (cohorts) based on shared characteristics and their behavior over a specific period of time. It helps to understand how user groups evolve over time and how their behavior changes or persists.
Core functions and features:
- Grouping users by cohorts: Users are divided into cohorts based on a shared characteristic (e.g., acquisition date, first interaction).
- Analysis of behavior over time: Tracking metrics (e.g., retention, revenue, engagement) for each cohort over a specific period.
- Visualization of trends and patterns: Graphical representation of data to identify trends and behavioral patterns.
- Comparison of different cohorts: Compare the performance and behavior of different cohorts with each other.
Typical use cases:
- Analysis of customer retention
- Effectiveness of initiatives and evaluation of changes
- Identifying long-term trends and behavioral patterns
- Lifetime Value (LTV) analysis
- Product or feature launch analysis
Answers questions such as:
- How does the retention rate for users acquired in January compare to users acquired in February?
- How does user engagement change in the first month after registration?
- Which cohorts have the highest average order value (AOV)?
- How does a campaign affect long-term user retention?
User Lifetime
Helps to understand the value and behavior of user groups across their entire lifecycle.
What is User Lifetime analysis in GA4?
User Lifetime analysis involves analyzing how users behave and what value they bring to the company, starting from the moment they first interact with the website or app until the point they become inactive.
It is closely linked to cohort analysis and is often used in the same context.
Core functions and features:
- Analysis of user value over time: Tracking metrics such as revenue, sessions, conversions, and engagement over the entire lifecycle of a user.
- Identification of high-value user groups: Identifying which groups have the highest lifetime value (LTV).
- Comparison of LTV across different cohorts: Compare the LTV of users acquired at different points in time.
- Prediction of future behavior: Using predictive metrics to forecast the future value and behavior of users.
Typical use cases:
- Optimization of marketing campaigns
- Improvement of customer retention
- Product development
- Budget planning
Answers questions such as:
- What is the average lifetime value?
- Which marketing channels bring in the most valuable users?
- How long does it take for a user to reach their maximum value?
- Which user groups have the highest LTV?
User Lifetime analysis is ideal for:
- Understanding the long-term value of users.
- Developing strategies to increase LTV.
- Allocating marketing budgets more effectively.
- Improving customer retention and engagement
Best Practices for User Behavior Exploration Reports
- Start with a goal: Define clear questions (e.g., user retention, conversion).
- Use segmentation purposefully: Cluster target audiences meaningfully (e.g., first-time visitors vs. returning).
- Monitor cohort formation: Analyze user retention over periods of time.
- Combine events and parameters: For deeper behavioral patterns.
- Supplement with other Explore formats: Path exploration for navigation and typical exits, Free Form for flexible ad-hoc analysis, Funnel exploration for conversion analysis, etc.
Limitations of GA4 Explore Reports: What to consider?
- Know the limits: Data storage in GA4 Explore depends on the configured data retention period.
- For in-depth or long-term analyses that exceed GA4 data retention periods or the limitations of Explore reports, and for the complete backup of raw data, BigQuery export should be considered.
- Export data: Transfer to BigQuery if deeper analysis is required.
- Heatmaps for click behavior are not available; an additional tool must be considered here.
- User Explorer: Since GA4 does not store personally identifiable information, targeted selection of specific individuals is not possible. Instead, random user profiles based on pseudonymous IDs are displayed – drawing conclusions about real identities is excluded.
- User Lifetime – Lifetime Value (LTV): GA4 calculates lifetime value only based on recorded interactions from the time of implementation and only with the available events and parameters. Previous purchases or external data are only included if they are actively imported.
Conclusion
GA4 Explore reports are well-suited for data-driven behavioral analysis along the customer journey. They provide nuanced insights into user groups, individual journeys, and long-term engagement patterns, far beyond standard reports. They enable precise optimizations, particularly with segment overlaps, user paths, and cohort analysis. However, they reach their limits with the data retention period defined in GA4, metric complexity, or continuous and long-term behavioral analysis. For deeper analysis, personalized metrics, or long-term observation, BigQuery is the ideal supplement: it extends GA4 with unlimited data history, individual SQL evaluations, and granular raw data availability.