Hands On Media Plan Control With Google Data Studio
Management Summary
Target/actual comparison in Google Data Studio
Instead of just seeing the actual sales, you immediately get a comparative view of the planned sales and thus a better basis for assessment. Of course, this also applies to costs, ROI and all other important key figures.
scenario
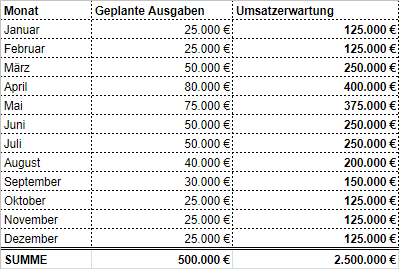
A company runs AdWords ads throughout the year. The annual budget for AdWords is set at €500,000, with peak seasons in Spring & More should be spent in the summer and less in the winter months. An exemplary onemuch more simplifiedMedia plan could then look like this:
Approach
Our goal should now be to be able to keep an eye on expenses and sales –without having to laboriously enter numbers manually in Excel or Google Spreadsheets.We get the current data fresh every day in Google Data Studio via the connector with AdWords – check. The challenge is our own media plan data. How do we get these for comparison in Data Studio?
The solution: We build a LookUp Table in Data Studio with our planned daily expenses and sales!
LookUp Tables in Data Studio: The CASE WHEN function
In addition to simply visualizing existing data, Data Studio enables the creation of new calculated metrics and dimensions. The possibilities here range from basic mathematical operations to more complex onesFeatures. One of the most powerful functions is theCASEFunction – with which we can now create a lookup table with our media plan directly in Data Studio!
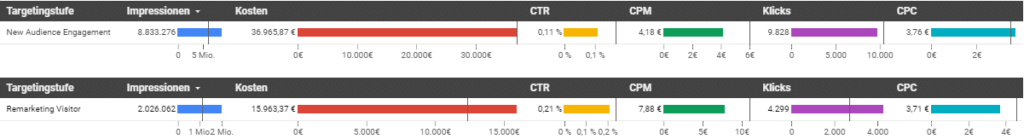
In our scenario we use the AdWords Connector and therefore compare with the following fields (German language setting):
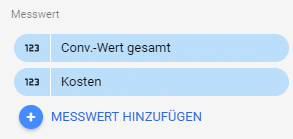
“Total conv. value” = sales
“Cost” = costs
We now want to compare this with our planned sales according to the media plan – namely ondaily basisso that we can carry out a daily check. Therefore, as a first step, we must include our expected costs and sales on a daily basis in the plan:
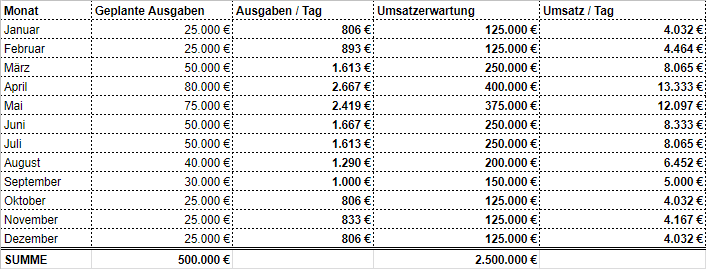
So we now know that we are calculating sales of €4,032 per day for January. So let’s start with the first stepmonth of Januaryto build our lookup table for sales comparison using CASE WHEN.
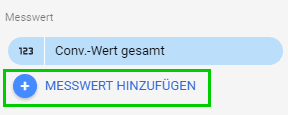
1. Create custom metric
2. Use CASE WHEN formula in new metric:


Here again as a copy & Paste – Formula:
CASE WHEN REGEXP_MATCH(Month, "201701") THEN 4032 ELSE 0 END
Our new metric will always give us “4032” as long as our selected period falls in January 2017 – exactly what we need for our sales comparison. For 2018, simply replace “201701” with “201801”. The formula looks complicated, but once you have successfully defined it for January, the modular principle continues (see below).
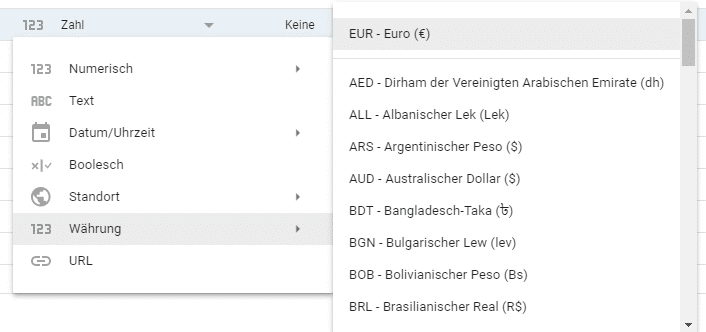
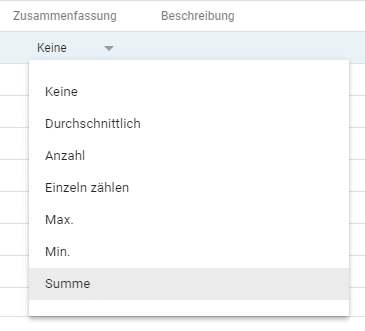
3. Set type and summary
Since we are dealing with euros, we should define the new metric as the type “Currency” and – so that our metric becomes a metric – determine the type of summary as “Sum”.
Moving on: complete the formula
We have already laid the foundation for our LookUp Table in Data Studio for the first month of the year – the most difficult part is done! For the remaining months we now nest the WHEN formulas one inside the other. The field in Data Studio is quite small – but in reality it can handle a lot ;). I therefore recommend completing the formula in a text editor and then copying it completely into the input field in Data Studio. The full formula for the costs in our media plan is then as follows:
CASE
WHENREGEXP_MATCH(month, “201701”) THEN 4032
WHEN REGEXP_MATCH(month, “201702”) THEN 4464
WHEN REGEXP_MATCH(month, “201703”) THEN 8065
WHEN REGEXP_MATCH(month, “201704”) THEN 13333
WHEN REGEXP_MATCH(month, “201705”) THEN 12097
WHEN REGEXP_MATCH(month, “201706”) THEN 8333
WHEN REGEXP_MATCH(month, “201707”) THEN 8065
WHEN REGEXP_MATCH(month, “201708”) THEN 6452
WHEN REGEXP_MATCH(month, “201709”) THEN 5000
WHEN REGEXP_MATCH(month, “201710”) THEN 4032
WHEN REGEXP_MATCH(month, “201711”) THEN 4167
WHEN REGEXP_MATCH(month, “201712”) THEN 4032
ELSE 0 END
Again for copy & Paste:
CASE WHEN REGEXP_MATCH(month, "201701") THEN 4032 WHEN REGEXP_MATCH(month, "201702") THEN 4464 WHEN REGEXP_MATCH(month, "201703") THEN 8065 WHEN REGEXP_MATCH(month, "201704") THEN 13333 WHEN REGEXP_MATCH(Month, "201705") THEN 12097 WHEN REGEXP_MATCH(Month, "201706") THEN 8333 WHEN REGEXP_MATCH(Month, "201707") THEN 8065 WHEN REGEXP_MATCH(Month, "201708") THEN 6452 WHEN REGEXP_MATCH(month, "201709") THEN 5000 WHEN REGEXP_MATCH(month, "201710") THEN 4032 WHEN REGEXP_MATCH(month, "201711") THEN 4167 WHEN REGEXP_MATCH(month, "201712") THEN 4032 ELSE 0 END
As you can see, we always have the same sequence of WHEN expressions that ultimately make up our table. To create a more extensive media plan, I recommend using text formulas in Excel – then a simple copy & Paste each KPI from Excel to get it into Data Studio.
So we have our LookUp Table for the monthly plannedSalesin AdWords based on daily expenses. For theCostThe same process must be repeated with a new metric and the corresponding values.
Compare should & actual
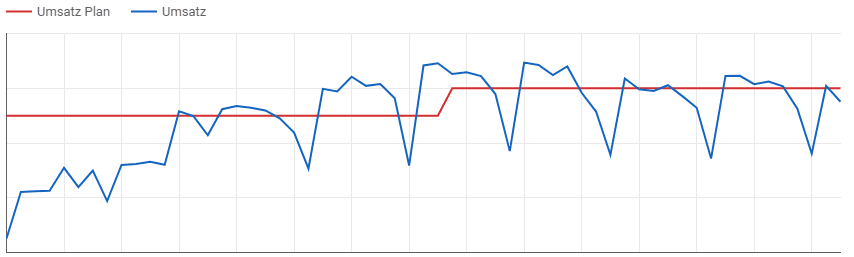
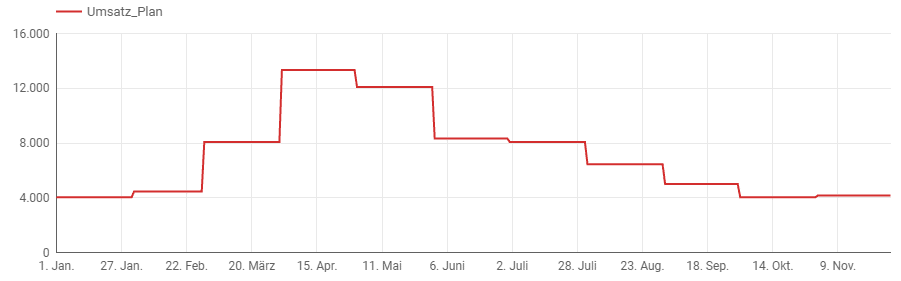
We can now use our planned values as a native metric and visualize them as a time series:
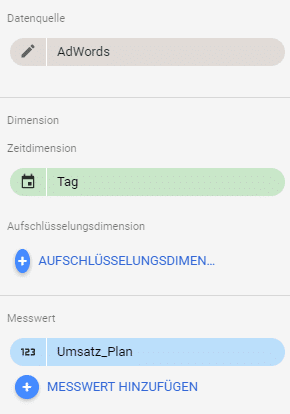
Since the AdWords Connector used does not extend into the future, it is advisable to initially test – as shown here – to refer the WHEN expressions (e.g. “201701”, etc.) to a current period. Otherwise, no values are shown to us (yet). If everything goes well, switch the WHEN expressions to the time period in the future (e.g. “201801”, etc.).
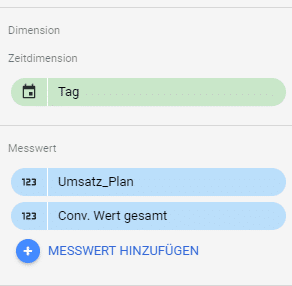
For the target/actual comparison, we now place our current data from AdWords on top of it by additionally selecting the metric from AdWords – at the same time we can also “zoom in” into individual months (here: January to February):
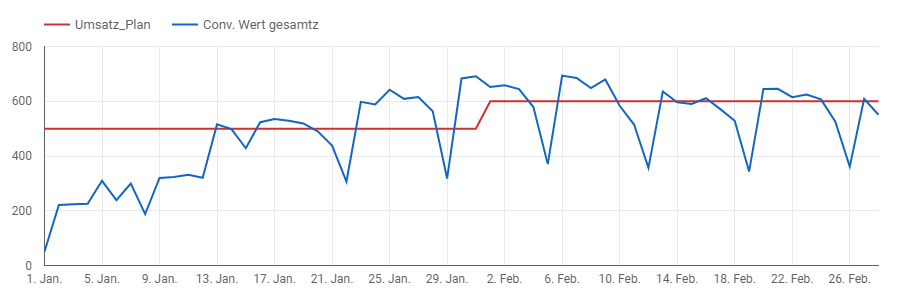
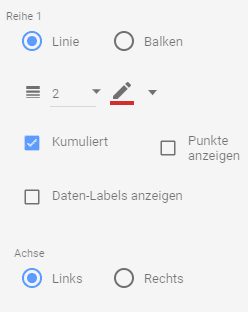
Additionally, I recommend the valuesaccumulatedTo visualize, you always have the total in view:
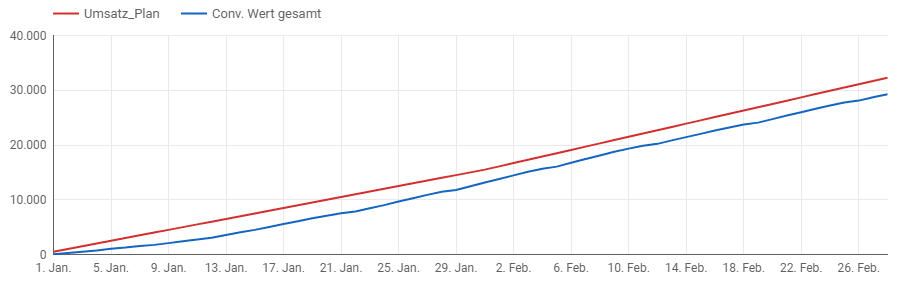
This means we can see at a glance that we generated less sales from January to February than planned! We should therefore intervene in good time and investigate the causes! In the same way, we can compare the current costs with our plan – maybe we spent less than planned?
We may also be interested in how high the deviation is exactly. For this too, we can simply create a metric for the difference and display it as a brief overview:
![]()

Conclusion and benefits
The big advantage of the approach shown is that the data is available natively in Data Studio – this makes any Excel tables that are sent around the company obsolete. This saves time and focuses on what is important.
The principle can be extended to all sorts of KPIs and channels – we’re only scratching the surface in this article. This makes it possible to use a media plan in Data Studio to build a control cockpit that serves as target/actual control for the rest of the year – manually “copied” tables are a thing of the past.