Insight Alarm User Explorer Provides Insights Into User Behavior
Management Summary
The user explorer overview
The new report can be found in Google Analytics atReports → Audience → User Explorer. Here, individual users are identified based on their unique ID and the 3 most important engagement and conversion values. By default, sorting is done in descending order by sessions – although sales are much more informative…

Primary dimension: Client ID vs. User ID
The primary dimension of User Explorer is the Client ID. TheClient IDis aUnique but anonymized ID for each user (browser)., which consists of a randomly chosen number and the timestamp of the first visit. It is set via the Google Analytics cookie and usually remains with the user for two years.
However, it is much more interesting if the Google Analytics User-ID feature is used: Because then the primary dimension of the User Explorer is automaticallyUser ID. Using the UserIDUsers recognized across multiple devices. This means that individual browsers or devices are no longer analyzed, but rather users who operate multiple devices. Consequently, user journeys become more detailed and, above all, more complete.
A notice:The Client ID / User ID as a dimension is currently only available in the User Explorer and cannot be used in any other reports. Except: It is also saved in a custom dimension via the tracking code!
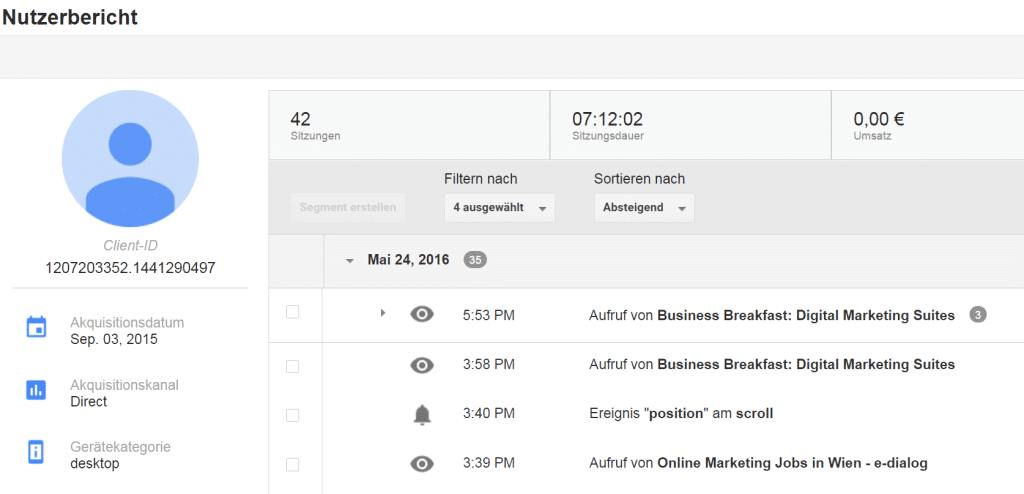
The user report
Let’s take a closer look at the user (hereinafter “User X”) with the highest sales (click on the desired client ID):How did the user behave? What did the user purchase?
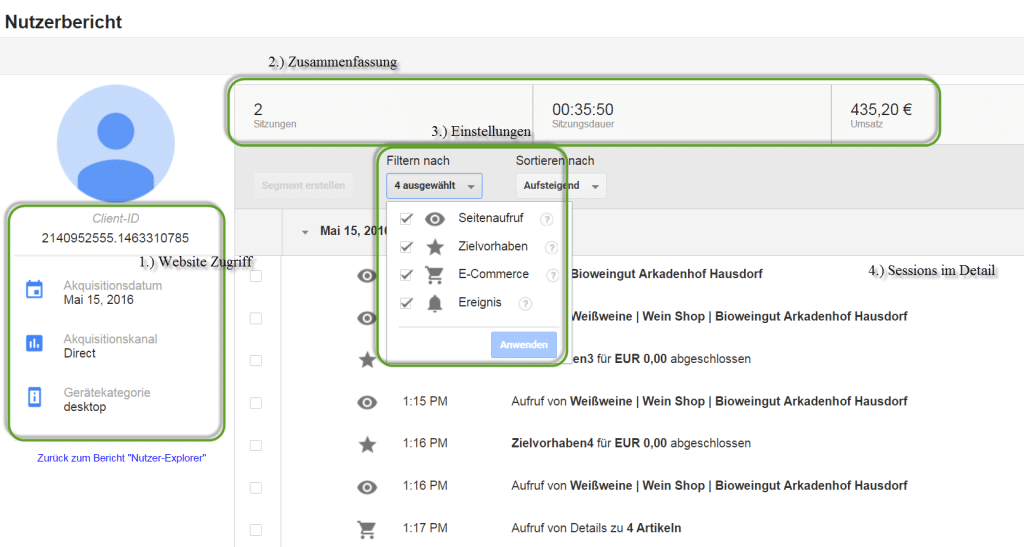
The user report is roughly divided into 4 areas:
- First website access:The column on the left contains information about the user’s very first website access: the acquisition date, the acquisition channel and the device category.
- Summary:In the column at the top right, the number of sessions, the session duration and the user’s sales are summarized. User
- Settings:Below there is the possibilityFilter interaction type. Available are: page views (eye), completed goals (star), e-commerce interactions (shopping cart) and events (bell). For example, if you only select the shopping cart, you can access theE-commerce customer journeyof the user can be filtered (requirement for this:Enhanced e-commerce).
In addition, the meetings cansorted ascending or descendingbecome. By default, sessions are sorted in descending order: However, it makes little sense to analyze access from back to front, which is why I recommend changing the setting to “ascending” at the beginning of an analysis. - Sessions in detail:Now to the most exciting part – Under Sessions in Detail, the user’s individual sessions are listed with all the interaction types selected above – per day. User In total, the user completed 72 interactions that day, which is revealed by the small gray box next to the date.
But that wasn’t all: With one click on an interaction you get valuable details, e.g. the URL of a page view, the product details for e-commerce visits, etc.The analysis can begin!
E-commerce journey analysis of user X
In order to find out what user X bought and how the user behaved during the purchasing process, it is recommended to filter by eCommerce interactions (= shopping cart). One click on an interaction and you get the action type, e.g. a product detail view as well as the product ID and name.
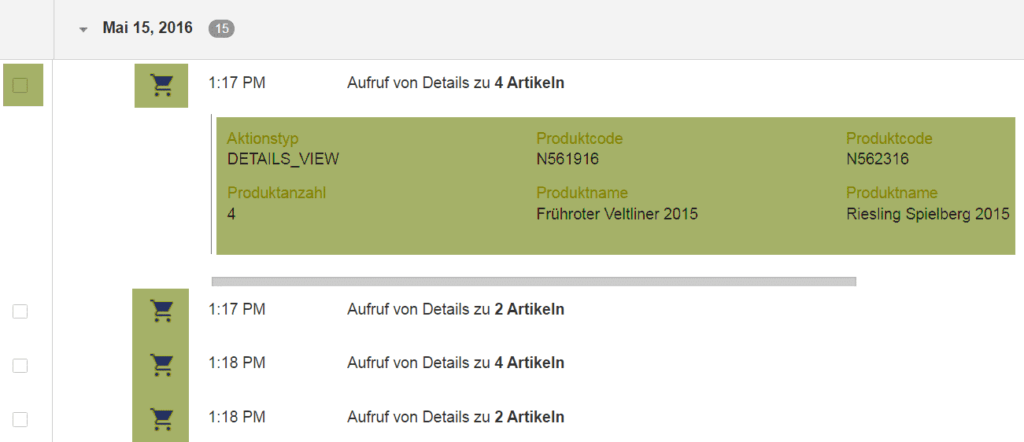
Note:In this case, 4 articles are displayed with a detail view. This is because similar products are suggested at the end of the product detail page, which are also displayed in this view.
User
Action: Create segments for remarketing
And here it can toofirst measure derivedFor example, if you select the Detail View of the Frühroter Veltliner (check the checkbox) and click on “Create Segment”, GA automatically creates a new segment. This can then be used to define a target group, which serves as the basis forRemarketing campaigns in AdWords or the DoubleClick Bid Managercan be used.
Analysis: Analyze user behavior in all reports
Furthermore, this canTarget group can be analyzed across all reportsby applying the segment to all reports.What demographic characteristics do these users have? Where do the users come from? Which pages did the users visit?etc.
Back to User X:After they converted after just 8 minutes and went directly to the website, it must be assumed that they are an existing customer who has refilled their wine inventory. A brief analysis of the other transactions shows similar user behavior. Apparently, it is mainly existing customers who make purchases on the website.Another measure can be derived from this: The goal of this website should also be to acquire new customers.
So far, so interesting! But is the User Explorer also useful for non-eCommerce websites? The answer is: yes!
Customer journey of user A
Let’s take a look at the user report (with the primary dimension user ID, i.e. the user is recognized across multiple devices) of a user (hereinafter “User A”) on our e-dialog website:
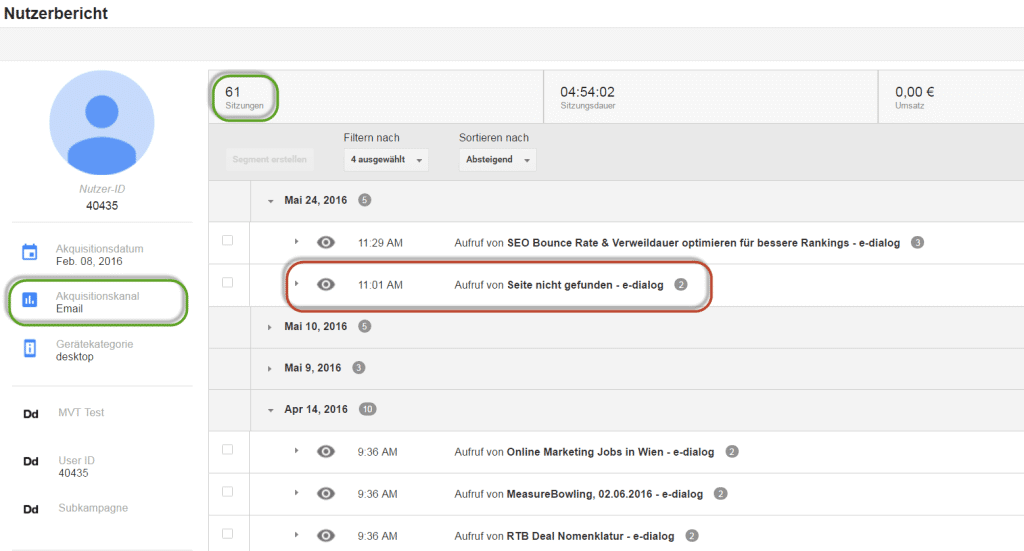
The report shows that we were able to get users excited about our website through our newsletter on February 8th. Since then he has come back almost every week: And the user was not only interested in our blog articles, but also in other website areas such as jobs and events. This is great for us and shows that the website relaunch last year is bearing fruit!
Here, too, it is a good idea to create a segment and analyze the user across all reports. We may be able to get in touch with them because they are either a potential customer or employee…
Troubleshooting:In addition – and this is particularly relevant for optimizing the user experience – the User Explorer helps to uncover errors, such as 404 pages (marked in red in the screenshot).
Conclusion
The new User Explorer opens up a variety of new analysis options. Thanks to the reports, you can find out how users behave in their journeys and can therefore improve their experience. This is particularly relevant in conversion processes.
Many new marketing activities also arise: non-converting users can be analyzed to find out why they did not convert. These users can then be reached again via remarketing and perhaps finally convinced.
In any case, aggregated data can now be broken down into individual, individual users – and that’s great.


