Join Options In Looker Studio How To Get The Most Out Of Data Blending

Management Summary
In this article, we will use an example data set to show you which methods Looker Studio offers for merging data and how the individual join types affect the final result.
Data Blending and Looker Studio
Data blending means that a subset of data from different tables or data sources is merged into a new data source. In Looker Studio, these merged data sources are called “blends” or “data blends.” A data blend can be used as a basis for various graphics, tables or control panels. Suppose you have created campaign reporting in Looker Studio where you present data from various sources such as Google Analytics, Google Ads or Facebook for a specific campaign. In addition, you would now like to add a summary page where, among other things, the total costs across channels or tools are reported in a scorecard. This challenge can be solved relatively easily using data blending.
This functionality has been available in Looker Studio for a long time and is also used very frequently in practice for various reporting use cases. In February 2022, Google released a product update in this context. Additional so-called join operators have been added to the data blending feature. This means Looker Studio can now cover additional use cases that were previously not possible. However, it also presents users with the challenge of understanding how data blending works and how these join operators affect the result. Data blending in itself is a complex topic and in practice it can quickly lead to errors in reporting and thus to misinterpretations. We would therefore like to provide you with a brief overview of the functionality of the individual join operators so that you are prepared for your next dashboard creation.
What are join operators?
Using join operators, two tables are linked in a specific logic when data is merged. In Looker Studio, the join configuration for the data blending feature was added to the product update in February 2022. There is now a choice of five join operators, which determine how the rows from the left and right tables are merged. In addition, so-called join conditions must be added to the majority of these joins. These can consist of one or more dimensions that are included in both tables and enable the data to be matched.
Let’s assume we are designing campaign reporting in Looker Studio and we want to compare not only the traffic generated for each campaign in a table, but also the costs of the individual measures. Unfortunately, the data comes from two different data sources, below“Data Source #1”and“Data Source #2”called.
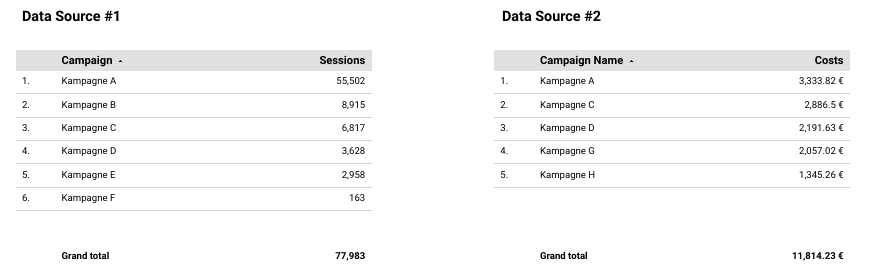
Data sources example, source: e-dialog
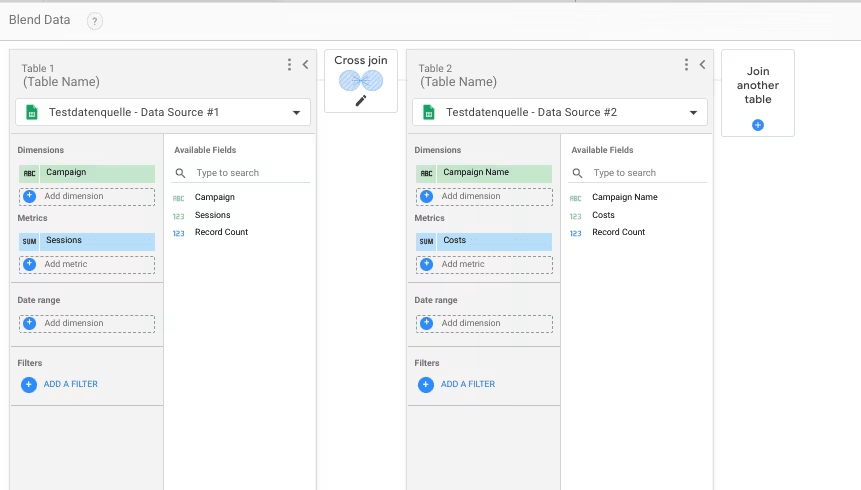
To blend these two tables or data sources with each other, we can, for example, simply click on both tables and right-click on the menu item “Blend data”. And then a new table appears with the merged data. But the data blend still needs to be configured correctly to ensure that we are shown the desired or correct data!
Using the table setup, you can see the newly created Data Blend data source under Data Source, which is automatically named “Blended Data”. By clicking on the editing pen you can access the configuration mask of the data blend.
Data Blend Source: e-dialog
In addition to the data sources, the dimensions and metrics that are necessary for the desired graphic or table creation can be specified here. When it comes to data blending, it is also important to define one or more join keys. In other words, which dimension with the same values occurs in one and the other data source and can be used as a “key” for merging the data. In addition, it must be defined according to which logic the data is merged – the join operators. Using the icon between the two tables (the icon with “Cross join” in screenshot 2) takes you to the join configurator menu. The relevant settings can now be made here.
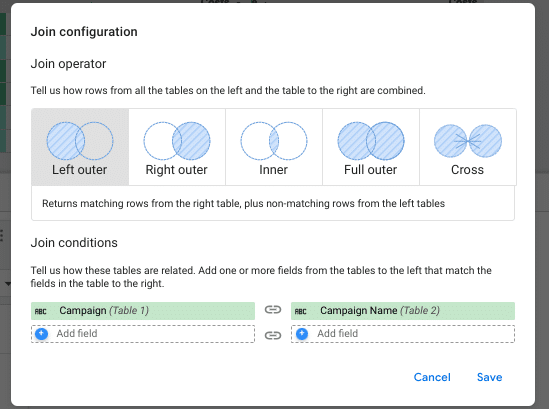
Join configurator, source: e-dialog
In our case, these are the dimensions “Campaign” in Table 1 and “Campaign Name” in Table 2, which both contain the campaign names and are therefore the join keys for our data blend. In addition, one of the five join operators must be selected.
Conclusion:
The data blending feature in Looker Studio has become even stronger and more flexible as a result of the product update, as it can cover additional use cases when merging data. At the same time, the already complex topic brings a further level of complexity and also requires an understanding of how classic join methods work. In our experience, this feature is used frequently, but is sometimes not always understood correctly and therefore brings with it an increased potential for errors in evaluations. In addition to understanding the functionality, the general ins and outs of data validation when creating reports also apply. So that you can be sure that you have set up your data blend correctly, comparing the data with the original sources is an important step in this process.