Looking Over The Users Shoulder Vwo Behavior Analysis
Management Summary
Heatmaps
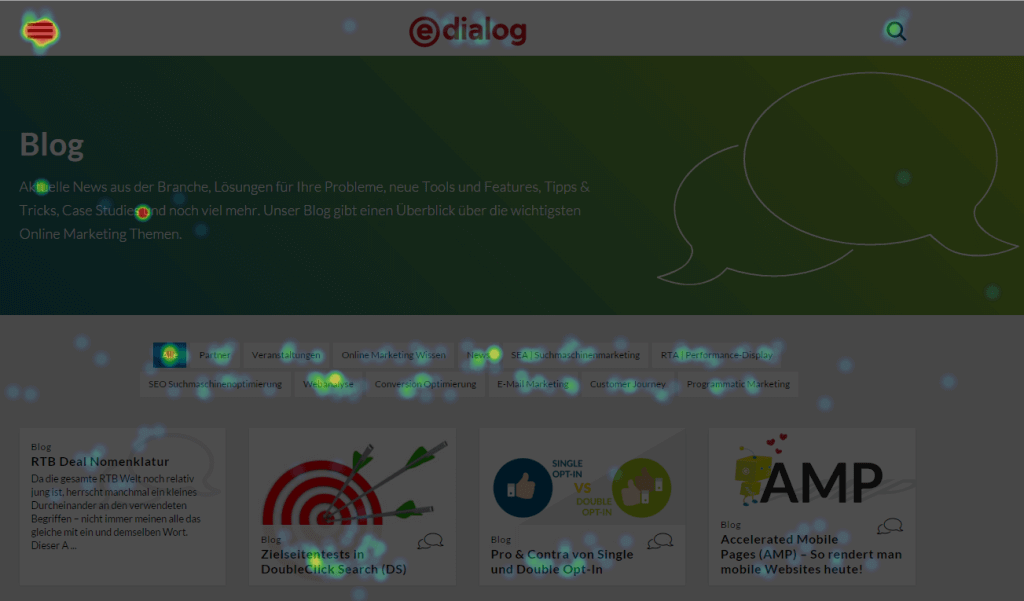
The Heatmaps module in Behavior Analysis places an overlay over the website that showshow often certain elements of a page are clicked on.The warmer the color, the more often people clicked here. Alternatively, you can create a mouseover effect for each element, which displays the number of clicks and a list of the most frequently clicked elements on the current page.
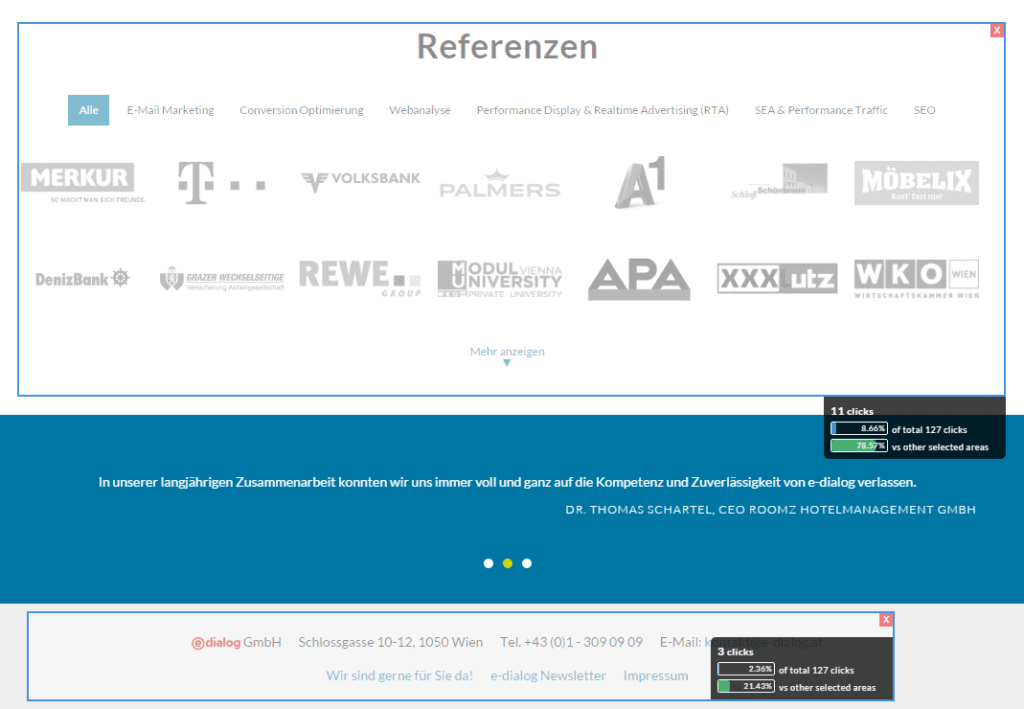
Also interesting is the possibility, instead of individual elements,evaluate entire areas of a pageallow. The mouse simply draws rectangles within which all clicks are summarized. In our example below, the clicks are shown in the footer and in the references area:
There is also a scroll map that provides information aboutwhat percentage of visitors saw this area of the websitehave. The warmer the color, the more visitors who have at least scrolled to this point or jumped here.
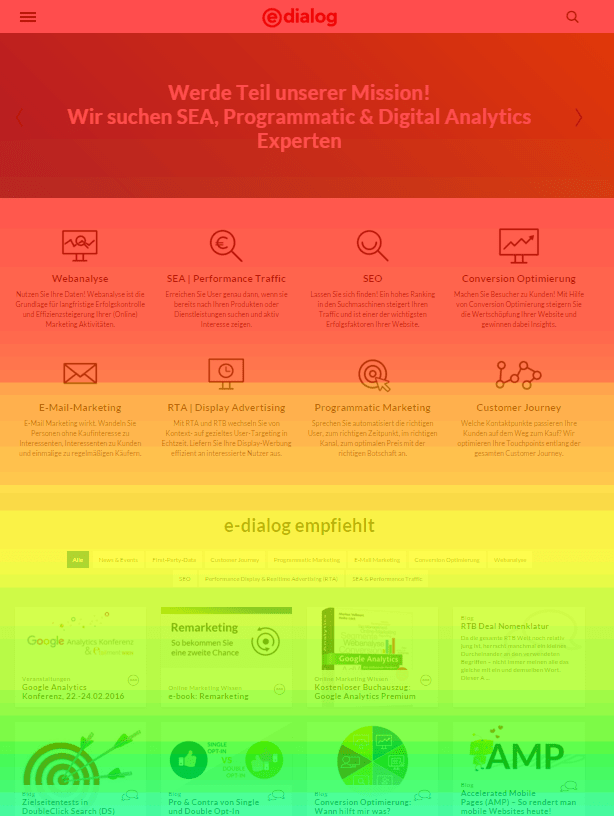
This makes it easy to seewhether call-to-action elements are actually seen by the majority of visitorsor whether a blog article is too long and hardly any visitors read it to the end.
However: If you click through to the anchor points at the end of the document, all areas between the link and the anchor are counted as seen, even though you have jumped over them.
Possible uses of VWO Behavior Analysis
It is easy to check whether link elements were actually clicked on. Behavior Analysis is particularly suitable, howeverIdentify elements where the visitor expects click behavior, but is disappointed: are some images clicked on regularly? Maybe they are too small to see anything and the visitor is expecting a larger version to open in a lightbox.Does my hamburger menu work?with my target group or is it not recognized as a navigation element?
Form Analysis
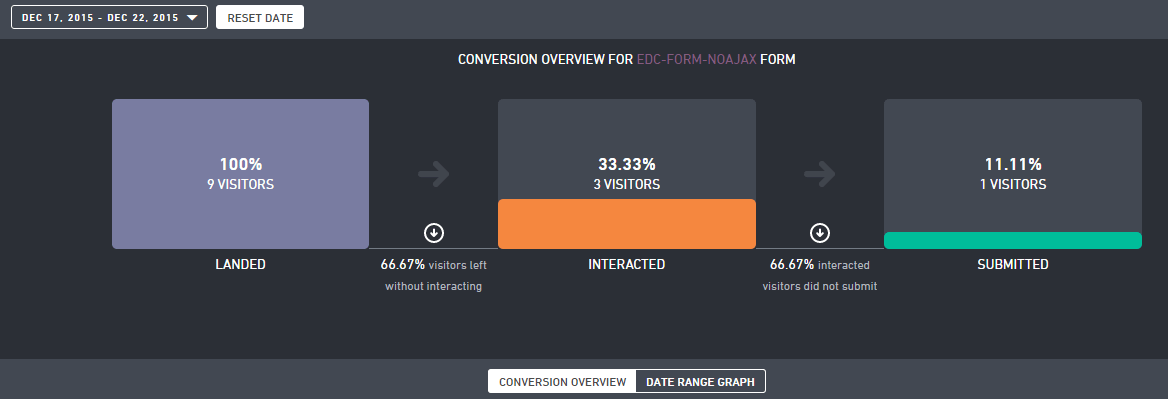
Very often our goals for a particular page have something to do with filling out a form: a newsletter sign-up, a contact request, or entering a shipping address and payment information. The form analysis provides valuable information,what prevents the visitor from converting. You get two infographics for each form that is entered: First of all, a summary of the form:

It shows how many visitors saw the form, how many started filling it out and how many then sent it. The latter reveals the first weak point in this module: only clicks on a button with the HTML tag are recorded as completionwas created., or even an implementation with completely different HTML elements likeorVWO does not recognize that the form has been submitted. At least that one– VWO should provide this variant later, the other variants are found quite often, but are not semantically correct and are sometimes difficult or impossible for VWO to recognize as a submit button.
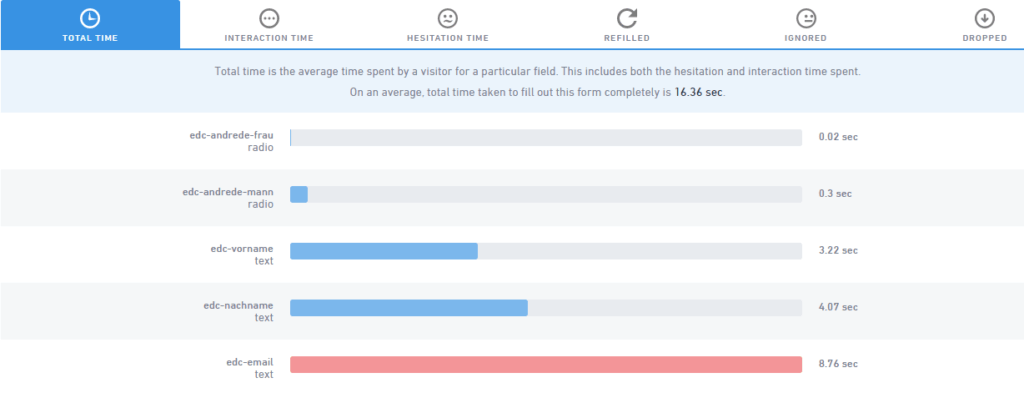
The second infographic then shows information about the individual fields of a form: For each field, the name of the HTML element and its type, e.g. B. Dropdown box, text field or button is displayed andhow long the visitor was occupied with this field. These times can also be broken down into interaction time (the time the visitor actually spends filling it out) and hesitation time (how long the field has focus but no input is made). Percentages are provided, such as how many visitors an input field hasignore, itfill out again, for example because the validation showed an error and how many people select a form field but then don’t fill it out.
Possible uses of VWO Behavior Analysis
An interesting function to discover hurdles when filling out forms – if your form withwas implemented. Unfortunately, you don’t always have complete control over this, for example if you use a newsletter subscription form created by your email marketing software and hosted on the provider’s server.
- Are yoursRequirements for passwords or telephone numbers too strict?
- asktoo personal data as a mandatory fieldaway?
- Is yoursForm too extensive?
Form Analysis helps you find the conversion killers. And if you are not sure whether you are drawing the right conclusions from the numbers, you can combine Form Analysis with the next module: Visitor Recordings.
Visitor Recordings
We saved the most spectacular feature – at least visually – for last: the visitor recordings. This willthe visitor’s entire session was “filmed”. Well, it doesn’t actually film, but rather creates a JSON object that contains the user’s actions. This means that you don’t see 100% of what the visitor saw. Pop-ups and drop-down menus or paragraphs are displayed correctly, and we were also able to recognize that a visitor from Russia had our website translated into Russian by the browser. Mouse-overs, however, are not displayed.
If the visitor uses a mouse to surf the website, the mouse cursor positions are indicated by red lines, left or right clicks are indicated by blue and green dots. Here you can see very clearly whether the visitor is able to cope with the page navigation or whether an article is actually read or whether it is just scanned. You can also often tell when visitors are thinking about clicking a link or filling out a form field, but then don’t do so, when the mouse cursor circles around a link for a long time or stays at that point.
Topic: Data protection
From a data protection perspective, the use of visitor recordings is problematic: just recording the session without the visitor’s knowledge is already critical. If forms come into play, it becomes even more dangerous because the entries can, but do not have to, be anonymized. This can make it very easy to assign the recording to a specific person, or it can lead to a faux pas like the following recording when filling out a contact form:
Before using visitor recordings, it is definitely recommended that youConsult a data protection expert, the visitor absolutelyto point out the recordingandForm inputsdefinitely tooanonymize.
Possible uses
When it comes to visitor recordings, you shouldn’t make the mistake of drawing conclusions from individual videos about the total number of visitors. Assumptions that should be based on one or a few recordingsalways with numbers, e.g. from the analytics softwarebe checked. It’s a shame that you can’t filter recordings according to certain criteria in order to specifically display recordings from users who, for example, haven’t completed a form or visited a certain page.
Nevertheless, the visitor recordings can be used to answer a wide variety of questions, e.g.:
- Which pathdo visitors take to get to a specific page?
- Whichstumbling blocksis there in my forms?
- Are Read More links clicked?
- Which areas of an article will beviewed longer, which ones are skipped?
The latter question is particularly interesting because it can hardly be answered with other tools such as analytics software or the other two behavior tracking modules.
Conclusion
Heatmaps and Form Analysis don’t actually provide any information that you can’t get with the analytics software. But for this to happen, tracking must first be implemented. VWO’s Behavior Analysis can provide the input as to which events can and should be tracked in the analytics software. Visually, the Behavior Analysis reports are of course very impressive and heatmaps and form analysis provide important information at a glance without having to study long columns of numbers.
In any case, all three modules of Behavior Analysis can be doneas a supplier of ideas for future onesA/B testingorRemote usability testingserve.Note:Since behavior tracking is still in beta, the various bugs were not taken into account in this article.


