Realtime Reports Arouse Interest With Real Time Report Analytics

Management Summary
The article contains useful information about the real-time report including all special features. The top features, such as viewing unregistered parameters and the user snapshot, are also explained.
What is behind the real-time report?
The Realtime Report, as the name suggests, shows real-time data. User numbers & Co from the last 30 minutes pop up and the world map shows where the users are currently coming from.
Google Analytics is not a real-time analytics tool. Google Analytics usually needs 24-48 hours to process the data and then display it in the reports. The manageable real-time report is the exception. The data from the last 30 minutes is available there in real time. As it happens, the number of users changes in the overview. Unlike the other reports, there is no option for personalization. The pen symbol in the top right corner is missing. However, comparisons can be used as usual.
In addition to the map, the report also consists of some information tiles about users, events, views and conversions. Another feature is hidden under “View user snapshot”. This snapshot provides information about which events randomly selected users are currently triggering on the website. For analysts, the Realtime Report can help with the implementation of new custom definitions. Parameter values can be viewed in the real-time report before registration in the GA4 interface. When campaigns go live, you can also check whether traffic is arriving on the website or on the new campaign landing page.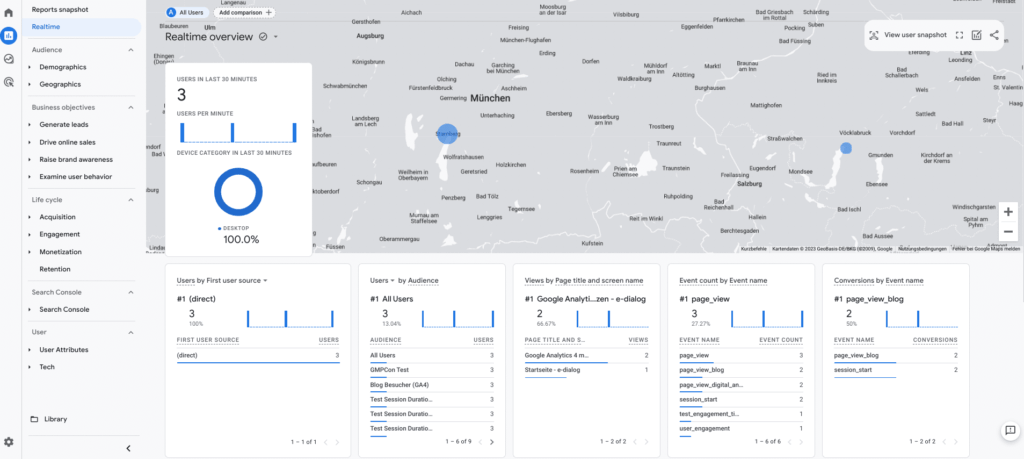 Overview of real-time reports in Google Analytics
Spark interest in Google Analytics with the real-time report
The lively report can pique the interest of those new to Google Analytics. A lot of traffic looks particularly impressive in the real-time report. But there are also areas of application for advanced users. For example, if you send a push notification for an action, the increase in traffic can be observed in real time. But even when a campaign landing page goes live, a quick look at the real-time report is worth its weight in gold. This means that the campaign manager can see whether a plausible amount of traffic is arriving on the landing page and an error in the campaign URL is not only noticed afterwards during the analysis.
What can the real-time report do?
The real-time report is located in the page navigation under “Reports” and “Realtime”. The first tile provides information about how many users with which device category were on the website in the last 30 minutes. Next to it is a map that shows where the users are. VPNs can spoof locations, making the report not 100% reliable. Nevertheless, the display gives a good overview of the users’ locations. Six additional tiles provide detailed information about user acquisition, audiences, views per page title, event number per event, conversions per event name and users per user property.
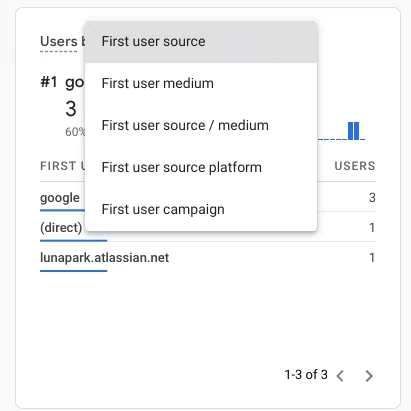
The arrows next to the headings allow you to switch between selected dimensions. The “Users” tile shows the acquisition based on First User. Here you can choose between First User source, medium, the combination (source/medium), source platform and campaign. However, only on a first user basis, which makes checking campaign parameters only possible to a limited extent. For target groups (audiences) you can choose between user and new user.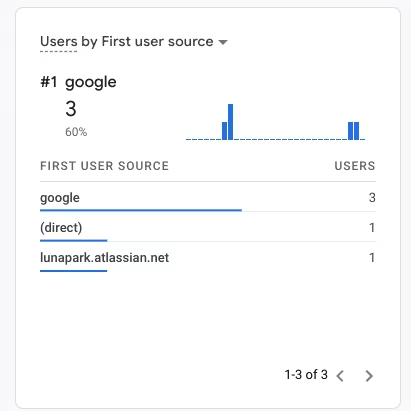
 Realtime Report Google Analytics – Users by First user
Top Feature 1: Viewing unregistered parameters
Particularly hidden is the option to view parameters and parameter values in the “Event count by Event name” tile. By clicking on any event line, all parameters that are included in the event can be seen. A further click on the parameter then shows the values that are given via this specific parameter.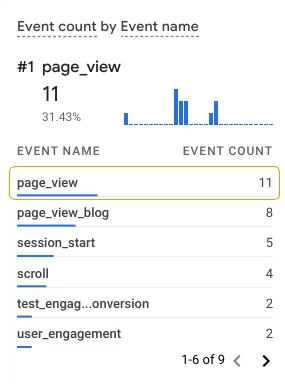

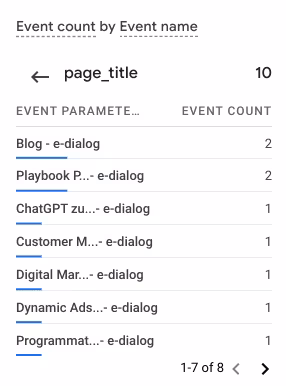 Realtime Report Google Analytics – Tile ‘Event count by Event name’ allows changing the parameters by clicking on the event line
This feature is particularly valuable because all recorded parameters are displayed, regardless of whether they were registered or not. It is therefore a way to find out which parameters are included in events and what is hidden in the parameter values without registering them.
Top Feature 2: User snapshot, be careful there is a risk of confusion with the debug view
Another feature hidden in the real-time report is the user snapshot.![]() Click on the “View user snapshot” button and a separate page opens.
Click on the “View user snapshot” button and a separate page opens. Realtime Report Google Analytics – User Snapshot
Here, Google allows, as an exception, insight into individual users. An arbitrary, anonymous user can be viewed from the browser, city, country and real-time event history. The chart looks similar to the debug view and also shows the logged events of individual users. However, the debug view is recommended for debugging and not the user snapshot. Because only an arbitrary user is displayed in the user snapshot and no specific user can be selected.
Conclusion
The real-time report is a standard report that is of little relevance to regular analysis work. However, it is good for illustrating current events on the website or in the online shop. Checking campaign parameters is currently not yet possible because the acquisition dimensions are only available in the real-time report on a first user basis. However, it is enough for an initial check to see whether the traffic is arriving on the website or campaign landing page. A hidden but helpful feature in the implementation phase is the ability to view unregistered parameters and their values. This feature is a real insider tip!


