Seo Bounce Rate 038 Optimize Dwell Time For Better Rankings

Management Summary
How exactly this data is evaluated by Google is of course a trade secret. However, there is some evidence that Google does consider the bounce rate and dwell time as a ranking factor.
The strongest indication of this was a short feature within the English Google results that allowed you to completely exclude recently visited websites from your own search results.
A bounce is a clear “negative indicator” for Google.
source: https://moz.com/blog/the-2-user-metrics-that-matter-for-seo
Another indication is a current patent from Google in which the “selfie camera” of Android devices should be used to optimize search results based on biometric signals, for example facial expression.
source: http://www.mercurynews.com/bay-area-news/ci_29792344/google-wants-take-your-temperature-and-count-your
Duane Forrester from Bing even publicly stated that “dwell time” is a quality factor for the search engine.
When a visitor comes to your site, all of their needs should be met so that they stay on your site for as long as possible. If your content does not convince the visitor, they will leave your site again. Search engines can detect this behavior by measuring dwell time. The time between clicking on the search result and returning to the search engine can tell you a lot. One to two minutes is good and strongly implies that users are actually consuming the content. Less than a few seconds is again a clear negative signal. Even if dwell time is not the only factor when evaluating content quality, we keep this signal in mind.
source: https://blogs.bing.com/webmaster/2011/08/02/how-to-build-quality-content/
If Bing is already looking at this data closely, it can be assumed that Google hasn’t just been doing this since yesterday. Of course, user behavior within the search results can be analyzed much more deeply.
- When the user returns, does he click on another result because he hasn’t yet found the information he wanted?
- Is the user entering a new search query that more precisely defines their first search?
- Does the user start a completely new search query because they came across a completely new topic?
- Has the user searched for a similar or the same topic before? In other words, does he already know his way around?
- Does the user generally have a poor retention time or only for some results?
- Is the user looking for a post that they have previously visited? (Returning User)
- Are other users looking for a specific post because they saw it on social media, for example?
- Is the behavior different for a certain user group (age, gender, interests, etc.)?
In other words: Google can do oursCustomerAnalyze search journey. This is a brilliant move because user behavior cannot be manipulated like backlinks or keyword density, but it can be optimized!
Important factors for user behavior
Before you start filling a landing page or website with content, you should first find out what the target group actually wants or is looking for. The simplest variant is classic keyword research with particular attention to long-tail search terms. We have now developed a solid workflow that aligns the title, structure and content directly with the user intent, which gives us an average of 4 minutes (!) longer visit time. We show the workflow in our workshop for content optimization.
Text is not the panacea. Matt Cutt’s call to “make great content” was and still is mistakenly reduced to text by many. Content is the umbrella term for text, images, video, audio, tables, animations, tools, etc.
Anyone who searches for “currency converter” certainly doesn’t want to be told in 3000 words what a currency converter is and how you could theoretically use it. Anyone looking for “beautiful landscape” wants to see pictures that are as high-resolution and colorful as possible, etc.
Navigation and structure
The previously defined content must now be put into a sensible structure in order to make the desired information accessible to the user as quickly as possible. Wikipedia does this quite well. Clear text sections, tables, images and jump label menu.
Loading times
We have already written enough articles about why loading times are important. Just very briefly: Long loading times = higher bounce rate. That’s why a slow site is bad for user behavior.
Analysis & optimization of user data
This section could have been its own post. This is due to the many options for analyzing user behavior.
Analytics bounce rate
In Analytics we already see the bounce rate in %. However, all visitors who do not click on another page count as bounces. This means that a visitor who reads an article with great interest for 25 minutes and then does not click on a second site still counts as a bounce.
The currency converter example mentioned above would have a terrible bounce rate based on these parameters. Most users will not view another site after successfully using the calculator.
It would therefore make more sense to set the period in which a bounce is counted to 10 – 30 seconds. But be careful! There is no general formula here. Ultimately, you have to estimate the time after which most users no longer need a different result. However, 30 seconds is a good guideline for most pages.
For those who aren’t tag managers and analytics nerds, I have the following code to copy:
With this code, an event is sent after 30,000 ms that it is no longer a bounce.
Analytics average time spent
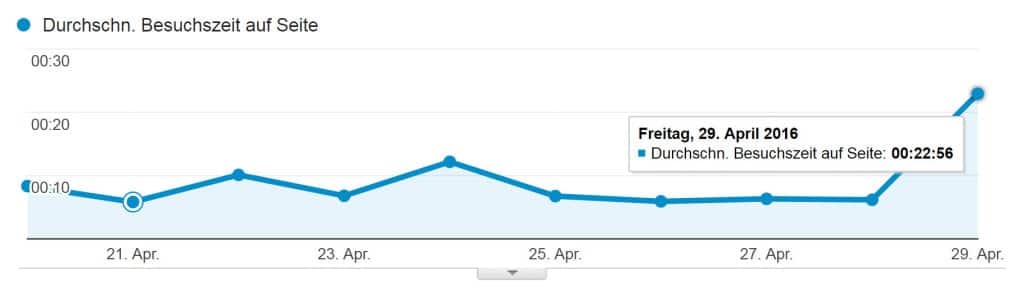
Since we have now limited the bounce rate to visitors who lose interest after just a few seconds, the average visit time per site becomes even more interesting. Unfortunately, we have a similar problem here as with the bounce rate: the average visit time is only counted if the user clicks on another subpage.
This also means that if a visitor reads an article with great interest for 25 minutes and then leaves, this is not taken into account in the average visit time. As far as I know, the best way to measure the actual visit time is the following:
Here we generate e.g. E.g. an event every 10 seconds that adds 10 seconds to the average visit time and only if the browser tab is actively selected. We have programmed a tag for the Google Tag Manager that I am not allowed to publish here. Tip: If you really want it,just ask me ;-).
User behavior
The analytics data shows at least once whether the user data is good or bad. The reasons for this can only be guessed at. But there are some tools that provide deeper insights into user behavior on your own site. These include scroll tracking, click tracking, mouse tracking, visitor recordings, attention tracking (Active Window part), etc. Tool providers such as ptengine.com, crazyegg.com, optimizely.com or vwo.com offer these and other functions.
My colleague Christof already has a very good one about VWOwrote a good and detailed report.
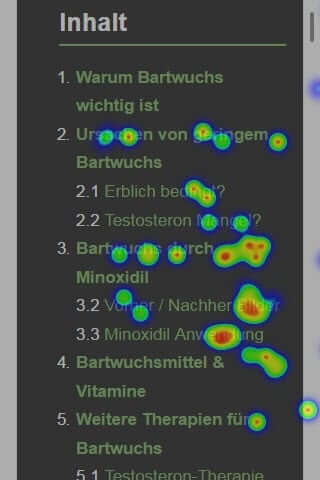
A simple but effective way to optimize the content of a site is to prioritize information from top to bottom. This is possible with a simple click map, combined with a jump label menu. Alternatively, most providers have a heat map for attention. However, this is not as accurate as the jump marks.
In the following example you can clearly see that the majority of users are interested in the third point, including sub-points. Now I can structure my text differently and move the third section to the beginning of the article or I give a note/link in the introduction: “Click here for section 3”.
How you use and analyze the data obtained from the various tools depends extremely on each individual site. These are not always meaningful or directional and sometimes you draw the wrong conclusions. That’s why don’t be ashamed to be involved in this very topicexperienced SEOsto work together.
Remote usability testing
Evaluating your own site is often only partially useful. A new user sees the structure and navigation of content completely differently. That’s why, for more complex websites that require a longer check-out process, for example, a remote usability test is one of the best ways to get suggestions for improvements and insights into user behavior that cannot be measured with any tool.More information about the usability test.
Conclusion
I’m happy about the new development! The rather dry and technical topic of SEO now takes on a human character and forces every SEO to deal with topics such as conversion optimization, copy-writing, psychology and user intention.
Click here for the first article in the user behavior series:https://e-dialog.group/blog/seo/bessere-rankings-durch-google-ctr-optimization/


