Visualizing Custom Events A Guide To Meaningful Reports

Management Summary
Our article will walk you through best practices to effectively visualize custom events and improve your analytical skills.
Custom Events
Custom events can be distinguished from standard events by their individuality and customizability, allowing for finer control over the data collected. These events can be used to precisely define which actions or behaviors are considered relevant, such as a specific click on your website or the length of time spent on a selected page. However, for this data to be truly meaningful, meaningful visualization is crucial. Here are some tips on how to achieve that.
Clear naming and grouping
Give custom events clear and meaningful names. Group them logically to create a clear structure in your reports.
Use context-rich event parameters
Integrate event parameters to capture additional contextual information about the custom events. This enables even more precise analysis, improved problem identification, and provides deeper insights into specific aspects of user behavior.
Temporal representation
Time custom events to identify trends and patterns in user behavior. Use time-based charts to analyze development over different time periods. There are several ways to visualize time representations.
- Among the “Explore” reports, which can be found on the homepage under “Explore”, you can select the visualization of a timeline when analyzing events when a new empty report is created.
- Under the “Reports” GA4 offers some pre-built reports on custom events over time, in which the development over time can be tracked directly in these special reports.
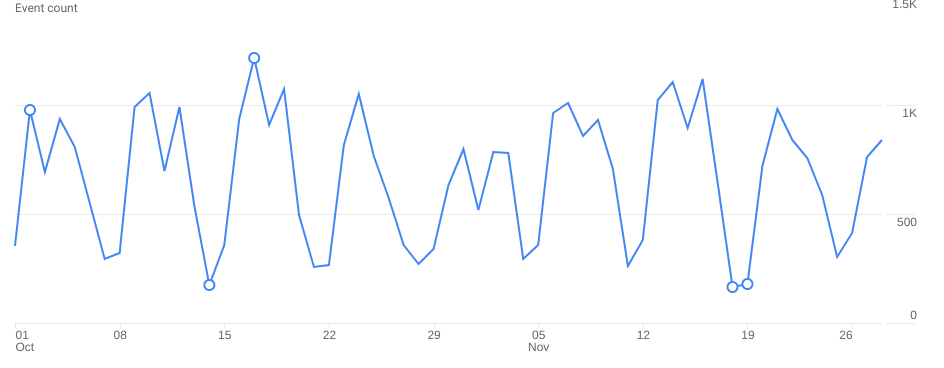 Timeline, source: e-dialog
Conversion funnels for events
Create conversion funnels to visualize users’ path through specific custom events. This helps identify bottlenecks and optimization opportunities. These are on the homepage under “Explore”.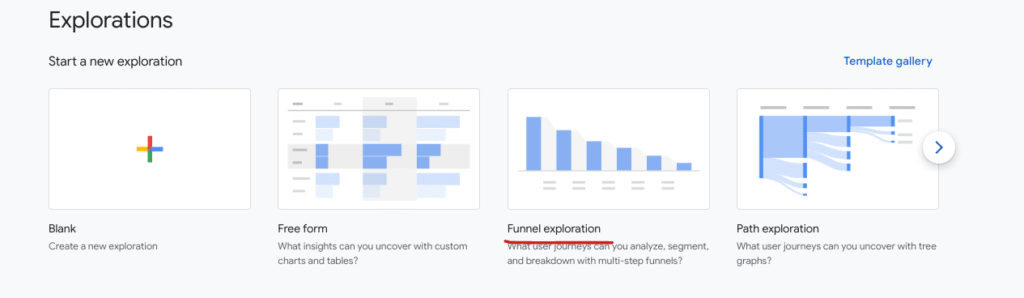 Conversion funnels for events, source: e-dialog
Segmentation by user groups
Segment custom events by different user groups to identify differences in behavior. This can be done by geo-locations, device types or other relevant factors.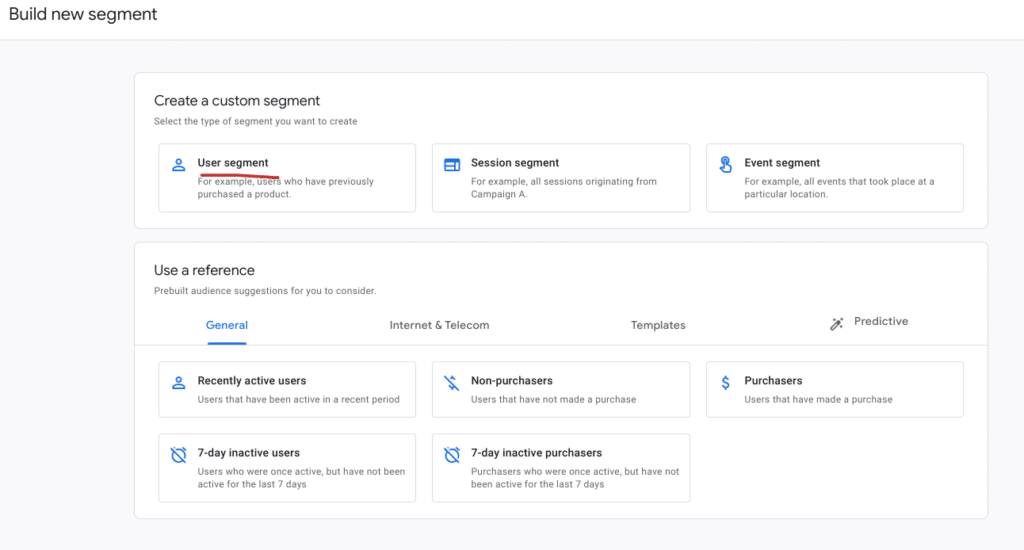 Segmentation according to user groups, source: e-dialog
The segmentation can be found using the following steps:
- On the homepage, click “Explore” and open a “Blank” report.
- Under the “Segment” section you can now add different user segments and segment them according to specific user groups.
Use visualization tools
Use visualization tools likeGoogle Looker Studioor other BI tools to present your custom events in beautiful dashboards. Diagrams, graphics and tables can clarify more complex relationships.
Conclusion:
Capturing custom events is the first step to gaining deeper insights into user behavior on your website. However, visualizing these events is key to making the information truly usable. Only clearly and meaningfully visualized custom events allow you to make data-based decisions and optimize your website experience.