Your Sitespeed Is In The Basement Identify The 10 Most Common Causes In Less Than A Minute
Management Summary
1. Poor backend performance
One of the most important factors is how long it takes for your web server to transmit the website’s requested HTML source code to the visitor’s browser. Only when the code has arrived in the visitor’s browser can the browser begin to load and display the individual elements of the page. Press F12 in Browser to enter Chrome Developer Tools and switch to the Network tab, then reload the page you want to test. You will then receive the waterfall diagram of the loading process. The first entry is important here. In our example, the website takes almost 4 seconds to transmit the HTML code. This means the visitor sees a white page for 4 seconds and nothing else. This usually indicates a problem with the backend system – perhaps your web server is overloaded or your CMS is not using caching.
2. Too many objects (requests)
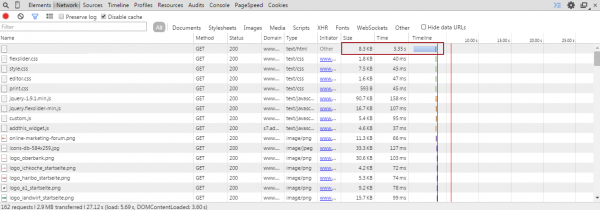
Every website is composed of different objects such as graphics, style sheets with CSS instructions and JavaScript(s). Every object integrated into the page generates a request (browser access) to your or an external web server and that costs time. The more requests, the longer your page will take to fully load. Here is the home page as an exampleNew York Times, which generates 274 requests and takes 30 seconds to fully load and render. The effect is mitigated by your browser’s local caching, but the goal should always be to generate as few requests as possible. If there are many objects requested from the same server (host), there is also the risk that you will have the fixed ones set in the browsersLimitsthe number of simultaneous parallel downloads come into play.
3. An “evil” object stops everything
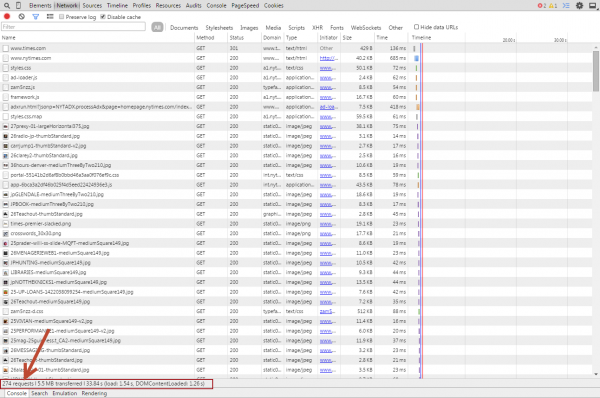
Often it is just a single object that negatively affects the loading time of your website. Such outliers can usually be easily identified in the waterfall chart due to their disproportionate length of the loading bar. Here you can see the exampleone pageby well-known UX expert Jakob Nielsen, how a single image increases loading time by almost 10 seconds. Images that are not optimized for the web are the bottleneck here. If you have a fast internet connection on your PC, this is usually not an issue; especially with slow mobile connections, it is very likely that you will lose your visitor.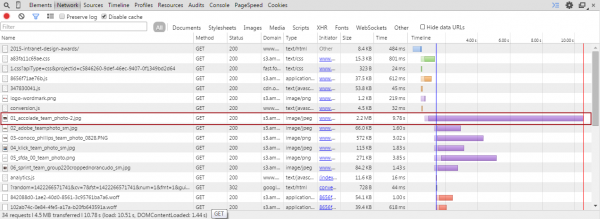 evil object
4. Network problems
Before a website gets to your visitor’s browser, it often takes many different paths. Depending on which server in the network an object is loaded from, different network routes are used. These all have different speeds and have different latencies. In the following screenshot you can see how such problems will appear in the waterfall chart. If you move the mouse cursor over one of the loading bars, a pop-up opens with detailed information about the respective request. In the example you can see that the DNS resolution to load part of the FaceBook Like widget takes almost half a second and then there is a waiting time of almost a second until the actual download of the resource begins. These effects also occur with third-party widgets that use their resourcesContent Delivery Networksoutsourced and whose network configuration is not optimal for the location of your website visitor.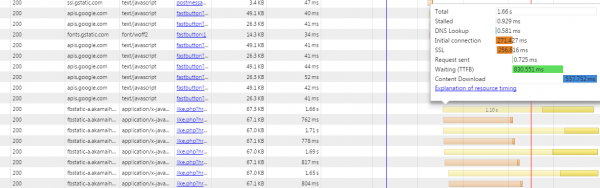
5. Slow download speed
If there are no network problems, your internet connection is sufficiently fast and yet many small objects in terms of file size take long to load, then it can be assumed that the internet connection of your server is not optimal. In Waterfall you can see this clearly in the darker portion of the loading time bar.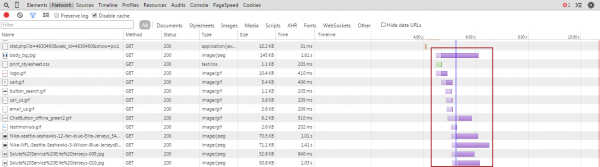
6. Blocking JavaScripts
Actually, on a fast website, the waterfall chart should ideally result in a line running from the top left to the bottom right with the shortest possible loading time bars. If large distances appear between two objects during the process, you can assume that an object is blocking the page from loading. These are usually external (3rd party) JavaScripts that cannot be loaded or parsed. For small scripts you should check whether you don’t have theminlineinto the HTML code (this also saves you requests). Modern browsers also support thisasyncAttribute for the integration of JavaScript and thus enable asynchronous loading. Scripts which still thedocument.writestatement can prevent asynchronous loading of JavaScript. Try these scripts like thischangethat you can do without these instructions.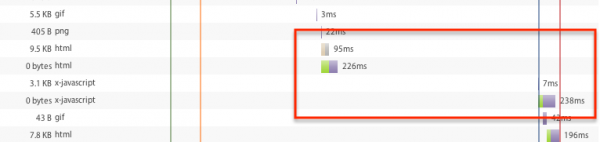
7. Errors on the page
Of course, you should also check whether your website can load without errors. You can see whether and how many errors occurred during the loading process in the top right corner of the Developer Console. These can be, for example, resources not found (status code 404), incorrectly configured servers (as shown here status code 500), or even JavaScript errors. Such errors should definitely be eliminated before you take any other optimization measures.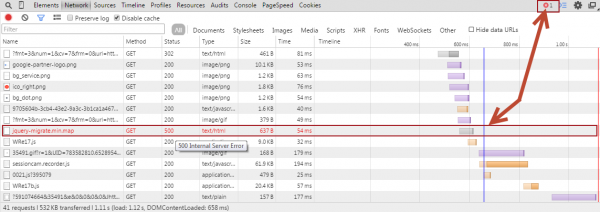
8. Objects are loaded in the wrong order
Make sure that you load those objects in your website that are interesting and important to the user first (content first). Example: Modern tracking scripts, for example, are usually not needed at the beginning of the page and can also be loaded at the end without restricting the functionality for the visitor. Also make sure that e.g. plugins from popular JavaScript libraries likejQuerybe loaded in the correct order. Unfortunately, many (especially older) plugins do not check whether the main library is already loaded and then generate JavaScript errors.
By the way:Accelerated Mobile Pagesrepresent a way to load objects and content on a page only when they are in the visible area of the website.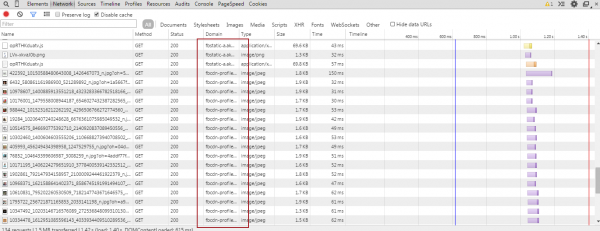
9. 3rd Party Tags
The mostly free 3rd party tags from social networks, video portals, or banner networks are popular and easy to integrate into your own website. Unfortunately, these widgets often tend to inject code into the page that generates a lot of reuqests. Below you can see an excerpt from the waterfall chart for a single Facebook widget, which already generates 20 requests.
10. Wait times for the page to render
Despite all optimization measures, the loading time displayed in the diagnostic tools may still be too long. This can have different causes. The more complex your website is, the more computing power and time the browser needs to display the page. Only more advanced tools can help here to visualize the structure of the page over time.Here using our own website as an example:
According to the diagnostic tool, our website takes approximately 5.3 seconds to fully load despite all optimizations.
That can’t be right? The answer is: yesandNo.
We use a CSS animation on our homepage. When this starts running, the rest of the website is actually already fully loaded and the user can interact with the site after just 1.25 seconds (without cache) while the CSS animation is still running. Paid tools likeYottaacan visualize this and help you correctly assess performance.
All of these tips didn’t help you?
With our tips, you have a good chance of quickly identifying problems that occur constantly and in the same place.
However, many problems only occur intermittently and are a combination of the various sources of error. These can only be identified through continuous long-term monitoring and in-depth analysis of the recorded test data.
We offer within the framework of aSitespeed reportWe provide all the necessary tools and services to identify the problems and causes and suggest concrete measures to resolve them.
Interest? Contact us!kontakt@e-dialog.group
PS: If your website doesn’t have a speed problem and you would still like to follow the tips, you can find themherea list of really slow websites ;-)


