Anomaly Detection Deviation Detection In Web Analysis

Management Summary
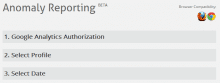
Setup – it couldn’t be easier
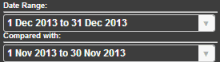
Anomaly detectionis a product that you can easily and practically connect to your Google account and then immediately use for analysis. After you select a profile in your account, you can also select the time periods to compare. Anomaly detection only works by comparingperiods, as this allows serious changes in the data to be optimally identified.
The first analysis
Thanks to the interface with Google Analytics, segments prepared in the account can be easily added, making the evaluation even more specific.
The first overview in the report shows the differences between the periods in terms of conversion rate, revenue and goals.
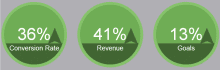
In the example above, all factors have increased compared to the last period. The question that now arises is: What caused this to happen?increase, how can this be explained?
Drill Down: How did this come about?
In order to analyze the conversion rate in more detail, you have to look at the changes in both visits and transactions:

The Anomaly Detection Report now shows which factors play a role in thechangeof the data played. However, since the overall transaction performance is better than the previous month, this may just mean that marketing efforts have attracted more interested visitors.
A practical example
However, since we know from the previous figure that the visits have fallen compared to the previous month, we should analyze this in more detail:
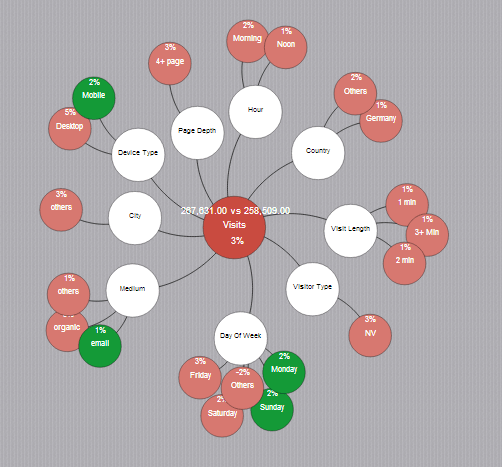
- In the middle is the to be analyzedMetricshown.
- The influence parameters are all around in white.
- They hang on it in greenDimensionswith positive influence and in red those with negative influence.
Therefore, we see that most factors have decreased in terms of visits to the website compared to the previous month. For example, although visits increased on Mondays and Sundays, access on the remaining days was comparatively lower.
After the visits have fallen by 3%, you should analyze the relevant sources more closely – where can I get fewer visits from?
From this example you can see that Organic was stronger last month than this one. One reason for this could be that there was less offline marketing activity this month than in the previous month.
Exciting insights
The evaluations now lead to the conclusion that although fewer visits were generated, far more transactions took place and as a result sales increased by 41%. Many would leave the information at that, but the phenomenon of the increases can be explained extremely easily:
After comparing the holiday shopping period to the previous month, the increase in sales and transactions is self-explanatory. An example of how it is always important to examine the overall picture and not just analyze individual sections.
This report shows them all at a glancerelevant factors, which have a positive or negative impact on the performance of the site.
Conclusion
Anomaly detection models are generally very helpful for automatically recognizing and displaying connections; Tatvic’s tool is easy to use in conjunction with Google Analytics and provides interesting analysis approaches.
It should always be remembered that the interpretation of the information should not be done carelessly, but should be post-processed using this intelligent system and Google Analytics for more in-depth analysis. You should definitely try this yourself – or of course with our support if you wish.