Better Rankings Through Google Snippet Ctr Optimization
Management Summary
Which user data is important?
There are 3 different metrics that matter to Google that we know about.
- Click-through rate (CTR)
Share of clicks through impressions in %. Appears in Webmaster Tools. - Dwelling Time
The duration until a user navigates back to Google. - Brand search
The number of users who search for a brand name (e.g. BMW, Merceds or Audi) or search keywords in combination with this brand.
This article will exclusively focus on optimizing CTR. Dwelling time and brand search optimization deserve their own article.
Click-through rate optimization
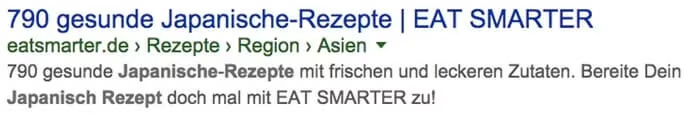
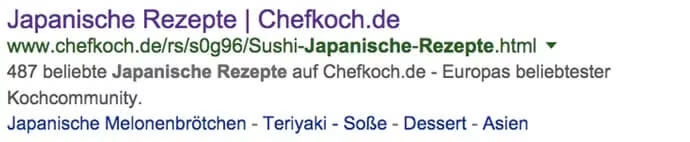
CTR optimization consists of 2 parts. The first task is to look at the top 10 results of the targeted keyword. I’ll take “Japanese recipes” as an example.
Then I take a close look at the titles and descriptions of the first snippets and think about which result is the first to be noticed? Which title would I click and why?

Now comes the real work. I want to be more noticeable and more interesting than the others. This can be achieved using numbers, special characters or “buzzwords”.
Buzzwords are words that we associate with strong emotions. For example: Attention, Sexy, Stop, Horny, Millionaire, Rock ‘n Roll, Yeah, Angela Merkel secret, money, deaths, vacation, etc. Whether we perceive these terms as positive or negative is relatively irrelevant. We subconsciously recognize the pattern of the word within a fraction of a second and a firework display from our neurons follows.
Another advantage is knowing the user’s intention. Anyone looking for “nasal spray” is more interested in fast delivery than a cheap price. When it comes to fashion, a large selection and price may be important.
In our example, diversity, exclusivity and effort are probably crucial. To get started, 2-3 variations of the title should be enough. For example, I would test the following titles:


Now we have the titles. Now we just have to find out which one delivers the best performance. To do this, I will test each title for around 5000 impressions.
Get the data!
Advancedwebranking publishes one every yearStatistics of average Google CTR. According to this, on average a generic keyword has 26.61% CTR in the first position, 14.88% in the second position and 9.54% in the third position etc…
position
1
2
3
4
5
6
7
8
9
10⌀ CTR in %
26.61%
14.88%
9.54%
6.49%
4.54%
3.32%
2.54%
1.98%
1.55%
1.12%⌀ with ads
21.48%
14.68%
10.66%
7.91%
5.97%
4.65%
3.73%
3.03%
2.52%
2.04%⌀ without ads
30.05%
19.48%
12.60%
8.57%
6.06%
4.36%
3.27%
2.54%
2.06%
1.59%
You now have to insert this data into an Excel table or a Google Spreadsheet.
Complete?
Then it’s off to Google Webmaster Tools, where you can view the impressions & Can export clicks from the last 90 days. The data can be found atSearch queries > Search analysis.
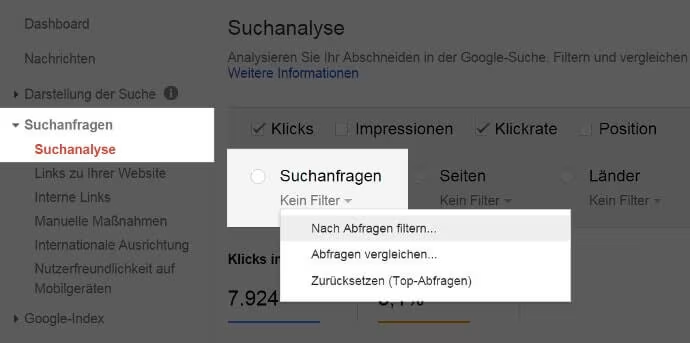
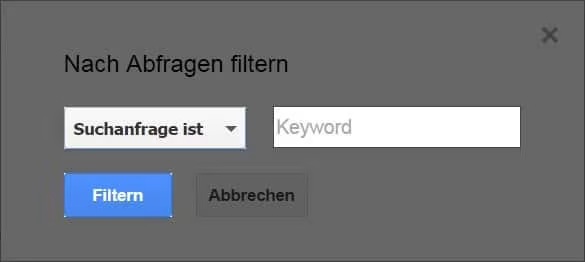
To select a specific keyword, you have to “filter by queries” and select “searches with”. This way you can define a desired keyword.
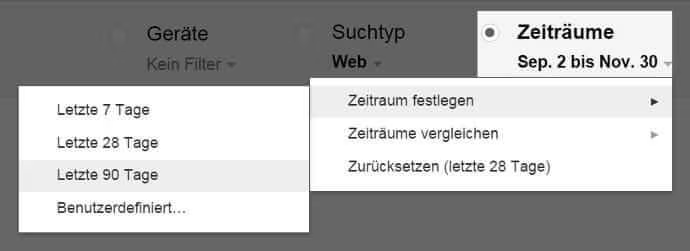
Last but not least, we have to select the time period. The maximum is 90 days. You can no longer access older data!
At the bottom left you can download the data as a table.
Evaluation of the data
From the list, the columns “Date”, “Clicks” and “Impressions” are interesting.
The position data can also be taken from the webmaster tools.
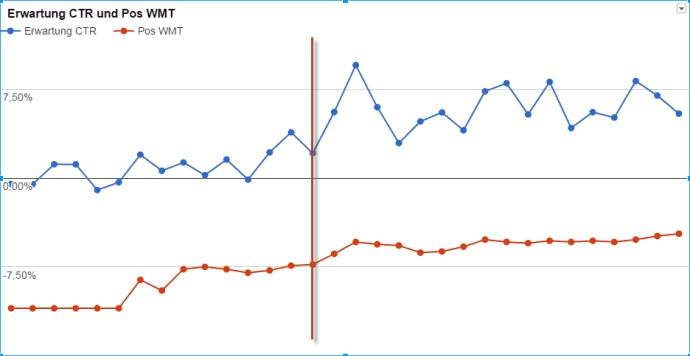
Now things get a little more complex. Namely, I want to subtract the expected CTR with my actual CTR. If the value is negative, I am below the average CTR. Anything above that is displayed as a positive value. The formula looks like this:
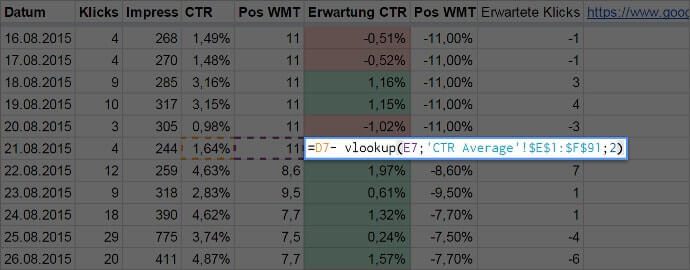
Now you have a daily overview of whether you are above or below the average CTR of Google search results, regardless of your position. Now I can A/B test my titles and descriptions every 2 – 3 weeks. The expectation, in my case column F, can be viewed wonderfully as a line diagram. The red line marks a title change.
Final thoughts
Aside from the fact that better CTR actually means more clicks, it has become an important ranking factor. Anyone who ignores user data in the future will have to queue “at the bottom”.