Consolidated Cost Reporting In Data Studio

Management Summary
Step 1: Create data source
Data Studio now has a native data blending feature, but for more complex merges we recommend our method as it offers you more flexibility. In our example we combine Google Ads and Facebook Ads costs; This list can be expanded as desired (Instagram, DV360, LinkedIn, Bing…).
In order to be able to report these costs in a consolidated manner, we create a Google Sheets table with the following tabs:
Google Ads
Here we use thatGoogle Analytics Spreadsheets Add-On, because we have linked our Google Ads account with our Google Analytics account (which we recommend you do anyway).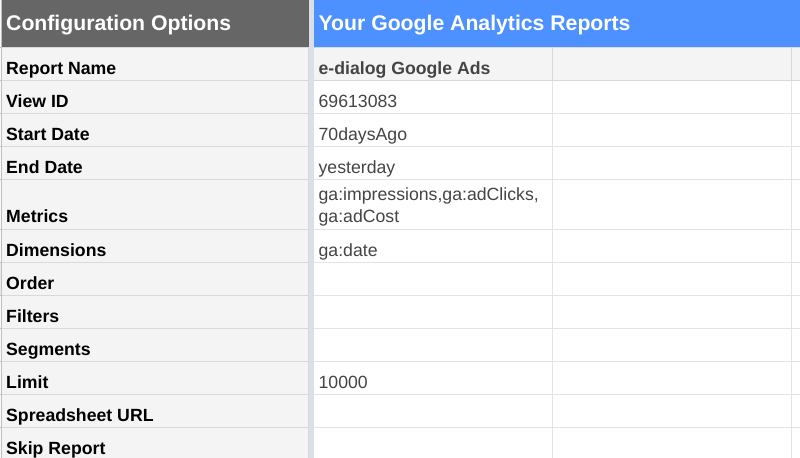 We limited ourselves to the Date dimension. If you need your dashboard to be more specific, you can add this to the dimension line.
Important: If you want your reports to be updated daily, you have to set this in the plugin under “schedule queries”.
At Facebook we are leaving the Google world for the first time. In order to be able to report costs in a consolidated manner, we reach into our bag of tricks and use the reporting toolSupermetricsas an intermediate step. To do this, you have to open the Supermetrics sidebar in Google Sheets and then select the metrics and dimensions that you want to have integrated into your cost reporting.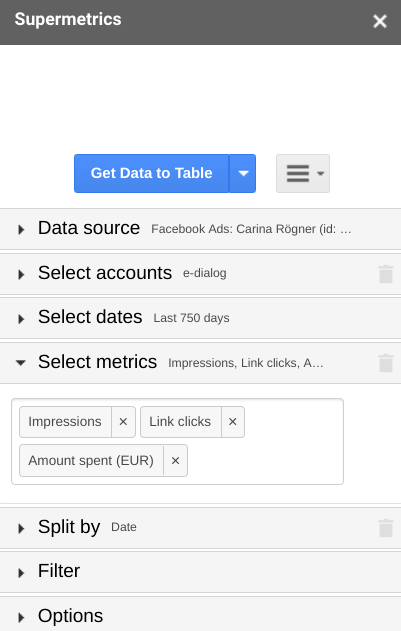
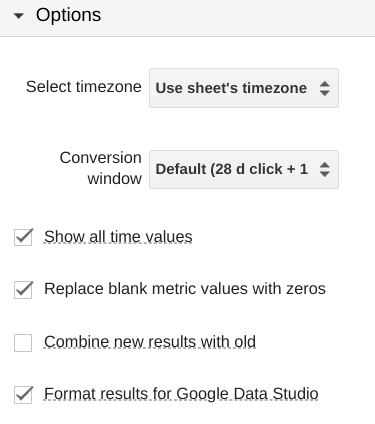
Important: If you create the data straight away in a Datastudio-compliant manner and have it updated daily, this saves you a few intermediate steps:
 In general, you can merge as many channels as you want, but as an example, two different sources are sufficient.
Step 2: Merge data sources
After you have linked the Google Sheets file to your various cost sources, you need to create a tab in which the costs are prepared for Data Studio.
You have to set up this “cockpit” tab as follows:
| Date | Google Ads costs | Facebook costs |
| ”=day()” | “=iferror(vlookup(A2,Ads,4,FALSE),0)” | “=iferror(vlookup(A2,FB,4,FALSE),0)” |
- Column 1 – Date:
With this function you can ensure that the most current data is always included. Simply enter “=A2-1” from the second line and copy until you have the required period. - Column 2 – Google Ads costs:
– “iferror” to print 0 if no value is specified
– “vlookup” accesses the output data from Google Ads
– “A2” is the date in the first column and the search key
– “Ads” is the area in the sheet in which the Google Ads data is displayed
– “4” is the column number in “Ads” in which the cost data is listed
– “False” simply defines that the data does not have to be ordered - Column 3 – Facebook costs:
– Works the same as column 2 and just accesses a different tab
Tip: In order to better visualize the budget framework, we usually also indicate the budget framework in an extra column in our dashboards. This can be filled both manually and dynamically (depending on what is most practical for you).
Step 3: Visualization in Data Studio
Once your data source is in Data Studioaddedyou can visualize the data, filter it and make it accessible to all stakeholders involved. This means you always have an eye on how much you spend on your campaigns and can focus on exciting strategic topics.
Example dashboard: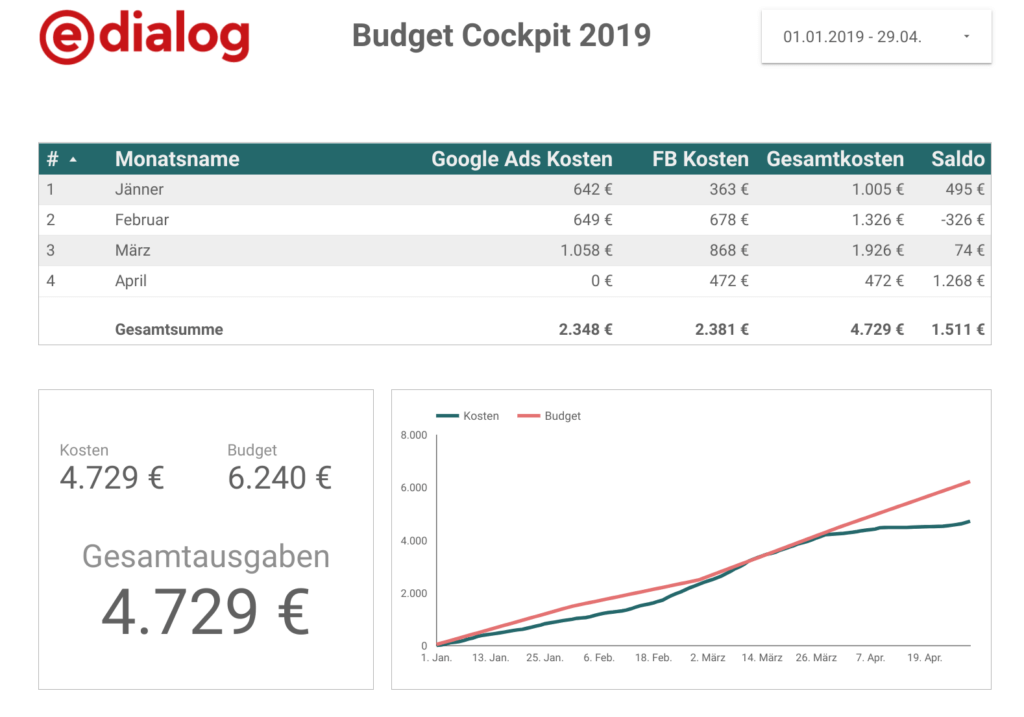 Have fun with the implementation!