GA4 Fundamentals for Campaign Managers

Management Summary
In this article, you will learn how to effectively use the most important metrics and dimensions in Google Analytics 4 (GA4) to better analyze your campaigns and understand your data.
A crucial difference between the new features of Google Analytics 4 compared to Universal Analytics is the distinction between Reports and Explorations. Reports are predefined views that display basic KPIs such as traffic and interactions. These are excellent for a regular overview of business development.
For deeper analyses, however, Explorations offers a collection of advanced analysis tools that enable companies to gain detailed insights into their users’ behavior.
To evaluate campaigns in GA4, it is important to use the correct metrics. The most important metrics for (programmatic) campaigns include:
- Sessions: The number of sessions initiated on your website or app.
- Engaged Sessions: The number of sessions that lasted longer than 10 seconds or included a conversion or multiple page views.
- Engagement Rate: The ratio of engaged sessions to total sessions.
- Bounce Rate: The percentage of sessions with no interactions.
- Events per Session: The average number of events per session.
These metrics help measure user interaction and engagement and optimize campaigns more effectively. However, it is also very important to combine the right dimensions with these metrics.
Which dimensions should be selected in Explore to display the correct data (for you)?
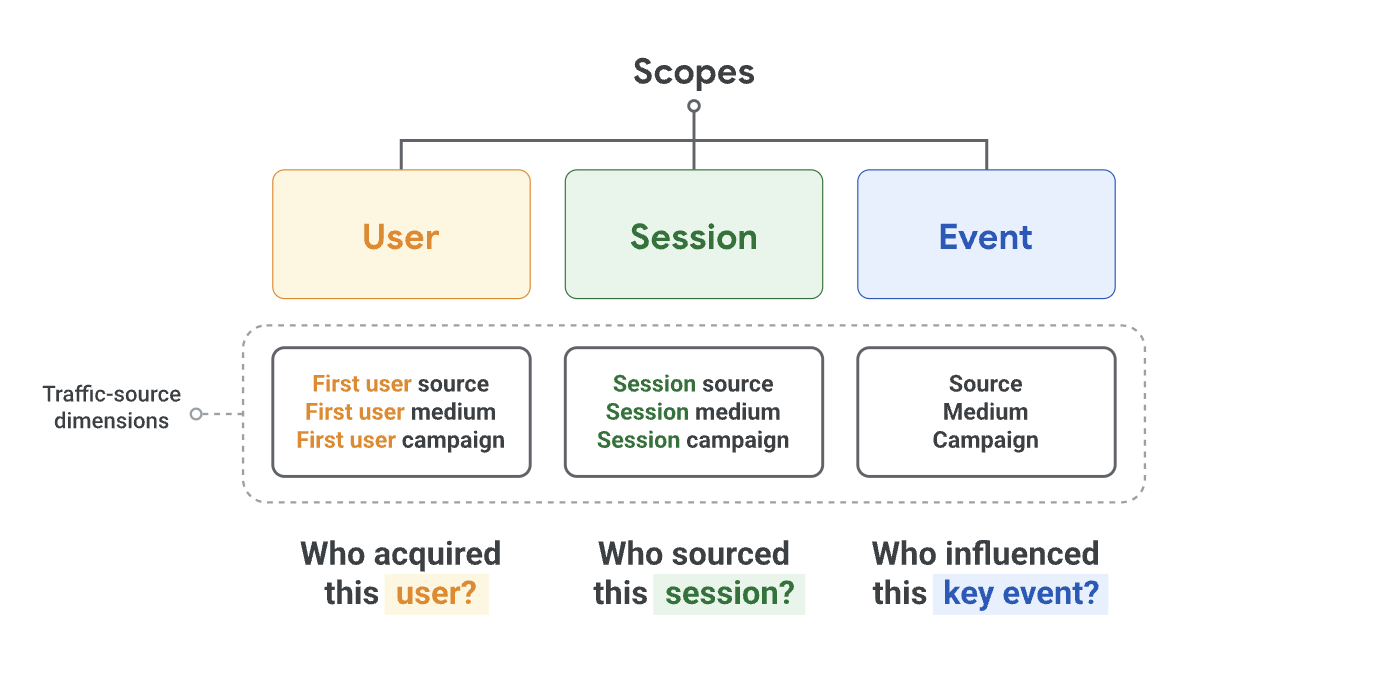
Firstly, it is crucial what scope the respective dimension has. Based on this, some dimensions are prefixed so that you can see where the data belongs.
You can find out more about this here and in this Google support article.
Secondly, we will also need different dimensions depending on whether Auto-Tagging or manual tagging (UTMs) is used. Auto-tagging allows the use of specific dimensions from tools like DV360 or CM360, while with manual tagging, campaign and source information are defined by the UTMs used.
Choosing the right dimensions and combining them in GA4 is crucial for visualizing data correctly. It is very important which dimension we choose, otherwise, we cannot visualize the correct key figures.
Here is a useful link from Google explaining session-based dimensions and metrics.
Example: If we want to display session-based data (metrics), we must choose session-based dimensions. These should not be combined with event- or user-based dimensions or metrics.
It is also important whether we use auto-tagging or manual tagging (UTMs) in our campaigns, as this also determines which dimensions must be selected.
Here are some examples of session-scope dimensions when:
Auto-Tagging is used (we can use DV360 or CM360 dimensions if the tools are connected to GA4. This is not an option for manually tagged campaigns):
- Session source platform (e.g., DV360)
- Session campaign or Session DV360 campaign name
- Session DV360 insertion order name
- Session DV360 line item name
- Session DV360 creative name
Manual Tagging is used:
- Session campaign or Session manual campaign name (=utm_campaign)
- Session source / medium (=utm_source, utm_medium)
- Session manual ad content (=utm_content)
- Session manual term (=utm_term)
How GA4 aims to improve data quality
Despite the correct selection and combination of dimensions and metrics, GA4 may not display the correct data. Of course, this can also be due to incorrect configuration, but assuming everything is configured correctly, GA4 can still have data gaps.
However, they are constantly working to improve data quality. Here are the most important measures they implemented in 2024 to avoid inconsistencies in the system.
New measures to improve data quality
Aggregate Identifiers: Google will introduce aggregated identifiers to ensure reporting accuracy when Google Analytics cannot automatically retrieve campaign information from ads. These identifiers help correctly attribute data and avoid misunderstandings.
Making data presentation clearer: Google is working on a clearer presentation of data to minimize two common problems:
- Over-attribution of Direct Traffic: A common problem in GA4 is that the system incorrectly attributes traffic as “Direct” when data processing takes longer. This can lead to erroneous analysis results. To address this, a new label “Data not available” will be introduced, indicating when data has not yet been processed, instead of falsely attributing it to direct traffic.
- Misattribution to Organic Traffic: Another problem occurs when GA4 cannot accurately determine whether traffic originates from a campaign or organic sources. This can happen particularly when user consents are missing or data from advertising platforms cannot be fully retrieved. In such cases, traffic will henceforth be categorized as “(not set)” to correct these misattributions.
Conclusion
Google Analytics 4 is a powerful tool that not only helps companies better understand user behavior but also supports marketing strategies with data-driven insights. The ability to gain deeper insights through the right metrics and dimensions enables more precise analysis and optimization of campaigns. Even though there are still some challenges, such as the incorrect attribution of traffic, Google is continuously working to improve data quality and presentation to enable users to perform even clearer analyses. With the correct application of GA4, companies can increase their long-term success and grow purposefully.