Data Sampling Problem Not With Custom Tables In Google Analytics

Management Summary
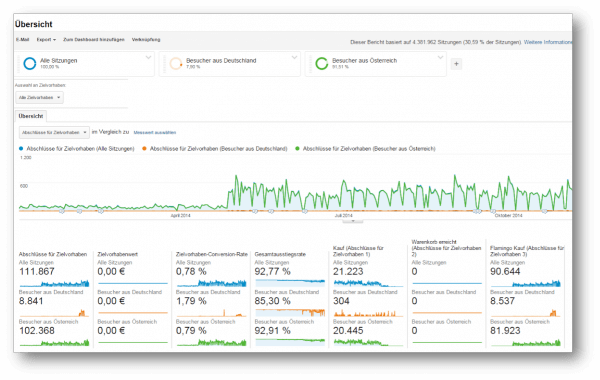 The image above shows what appears to be a completely normal report: namely thisTarget completionsforall goalsin our e-dialog profile inYear-on-year comparison2014 to 2013 –so far so good. Additionally we havetwo segmentsapplied to the overall data to find out whether there were more target completions in Austria or Germany –so far so good.
With this report you can see wonderfully and at first glance that overall there were more visitors and more purchases from Austria than from Germany – this information will be incorporated into future company decisions.But did you also discover and read the information in the first line of the report?
Data sampling
Atsoooolarge amounts of data(4,381,962 sessions)and the additional use of a year-on-year comparison as well(two at the same time)This analysis is based on segmentsno longer at 100%of the data butjust moreon a tight note31%.In order to access standard and custom reports more quickly, Google Analytics samples large amounts of data that would require too much computing power.
Sampling means that not all of the data is used for the analysis but only a part of it – in this case a third. It will be thatSampling procedureapplied.
Sampling is widely used in statistical analysis because analyzing a subset produces similar results to analyzing all data. Additionally, sampling speeds up the processing of reports with large amounts of data, as they can be processed very slowly. This not only increases the loading time of the reports but also does not put too much strain on Google’s computing power.
Data sampling is done by Google Analyticsautomatically, if for a reportmore than 500,000 sessionsbe recorded (seeGoogle Analytics Data Limits Documentation). For reports that visualize visitor flow, sampling occurs as early as 100,000 sessions.But what if an analysis of the entire data set is desired? Without sampling?
The solution to the puzzle: Custom Tables
This is exactly why Google offers its Analytics 360 customers the new 360 feature called Custom Table.
With custom tables orcustom tablescan create custom reports with a combination ofDimensions, metrics, segmentsandFiltercreated by Google Analyticsdaily without samplingprocessed. This requires a special configuration in the Google Analytics Admin Interface.Important:A custom table deliversno new reportin the Reports interface. A custom table is a configuration whereby all data that matches that specific configuration uses the table by default.
How To: Create a custom table
Custom tables are onProperty levelcreated and configured. You can do this in the administration interface underProperty -> Custom tables, after selecting the desired property,maximum 100 custom tablescreate. Once custom tables have been created, they cannot be subsequently edited. In order to make changes, it must be deleted and recreated.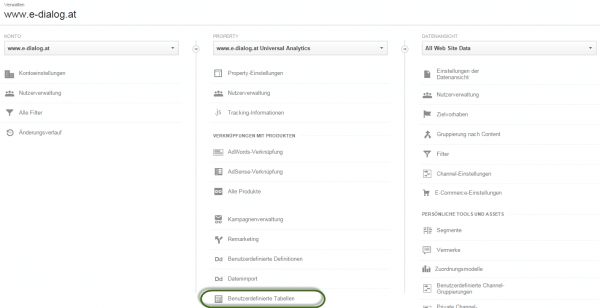 Theconfigurationworks the same as when creating onecustom reports: You choose onenames,the one you wantViewand a short oneDescription,selects up to 6Dimensionsand up to 25Metricsfrom, addsSegmentsandfilteradded and saves it.
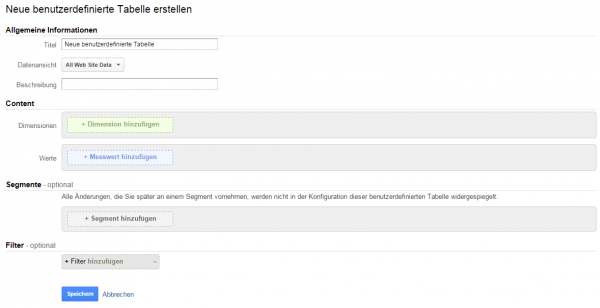 The data is then pre-calculated in the Google Analytics backend and made available after 48 hours at the latest. About the administration interface and the selection“Show custom table”The unsampled report can be accessed in the action drop-down. It is also possible to delete the user-defined table here.
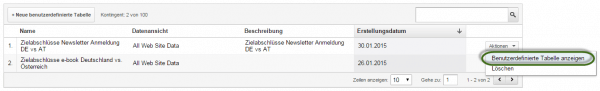 Important:Custom table queries cannot onlycan be created via the Google Analytics Admin interface, but also via theGoogle Analytics API e.g. via Google Spreadsheets.The Custom Table queries are based on normal GA Reporting API queries – namely on exactly the same settings (dimensions, metrics, filters, segments) that are also queried in the Custom Table. Google is taking actionin the background automaticallyaccess the custom table if it is available. If no custom table is available, Google automatically grabs the sampled data from GA.
Custom table analysis
The analysis described in the introduction looks like this using Custom Tables: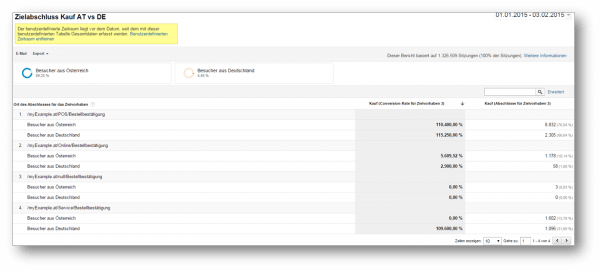 Very elegant! Very clear!And above all: Unsampled!
![]()
Summary and overview
Custom tables are used to obtain unsampled reports for large scale analyses.
- The data is stored in GABackend pre-calculatedand then made available in the admin interface – this can take up to 48 hours.
- This allows the datamuch faster(<1 minute)are provided and are, as I said,unsampled.
- Queries can be made via thisinterfaceor theAPIbe created
- It canup to 100 custom tablesbe created per property. The available quota is always displayed right next to the create button.
- Once created, custom tables cannot editedbecome. In order to make changes, it must be deleted and recreated.
Custom tables are a powerful tool that is a great blessing, especially for large scale implementations.