Matomo Scroll Tracking: Setup with Tag Manager & Insightful Reporting

Management Summary
To understand user behavior, it’s not enough to simply count page views. When you publish long-form content, articles, or landing pages, you need to know whether visitors are actually reading your text or leaving the page right after the hero section. That’s where scroll tracking comes in.
Although Matomo has built-in features, using a custom JavaScript solution via the Matomo Tag Manager (MTM) gives you detailed control over your data, prevents server overload since the code is triggered only once per page, and consolidates the data in a clear, organized way for reporting.
Step 1: The custom JavaScript
Instead of triggering an event every time a user scrolls a few pixels, the following script calculates the maximum scroll depth and only sends the data to the data layer when the user leaves the page (beforeunload event).
It calculates the percentage of the way through the document and organizes it into clear groups (0%, 25%, 50%, 75%, 100%). It also calculates the total height of the document to provide context for the page length.
This script is implemented using a custom HTML tag in Matomo Tag Manager that is triggered on a “Pageview”:
Step 2: Setting Up the Matomo Tag Manager
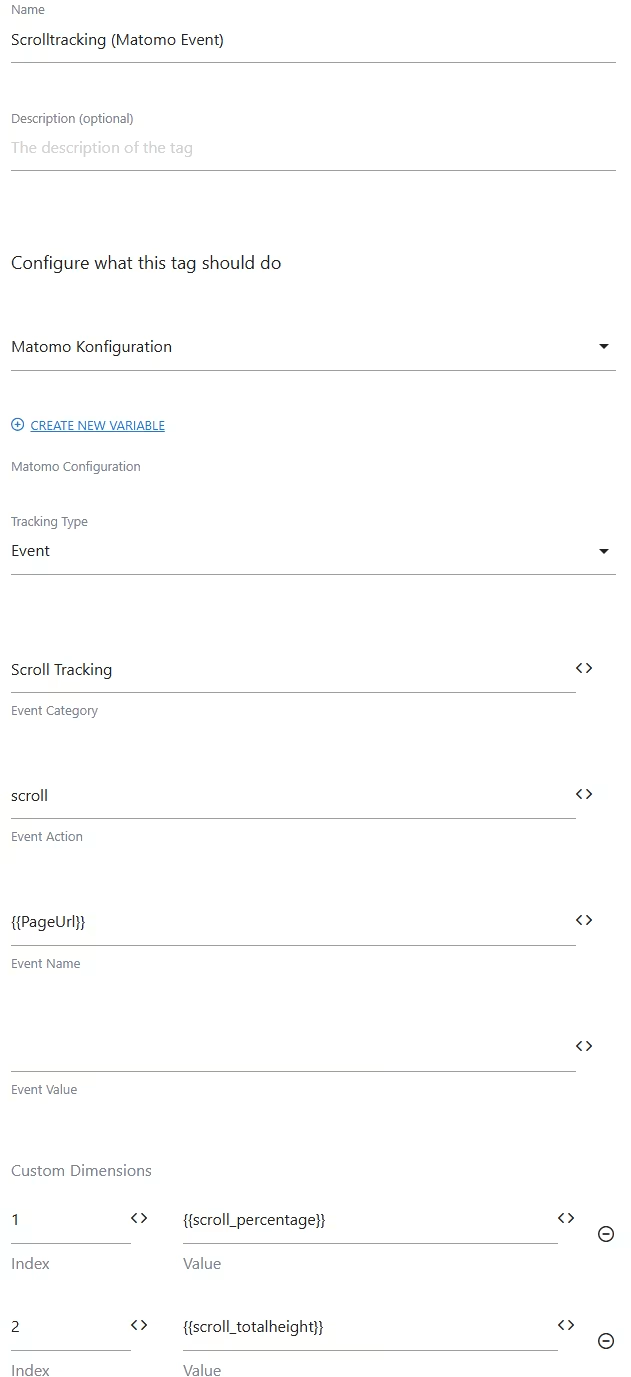
As soon as the script sends data to the data layer (window._mtm.push), you must capture it.
1. First, create data layer variables in MTM for the keys passed by the script:
- scroll_percentage
- scroll_percentage_int
- scroll_totalheight
2. Next, create a custom event trigger that listens for the event name “scroll. “
3. Finally, create the Matomo Analytics tagto transfer this data to your reports. Set up the tag configuration according to best practices as follows:
- Tracking Type: Event
- Event Category: Scroll Tracking
- Event Action: scroll
- Event Name: {{PageUrl}}
4. Adding custom dimensions: To make your reporting even more powerful, assign the remaining variables to custom dimensions (make sure these slots have been created in the Matomo settings beforehand):
- Dimension 1: {{scroll_percentage}}
- Dimension 2: {{scroll_totalheight}}
Step 3: Reports and Insights
Once this configuration is active, go to the Matomo dashboard.
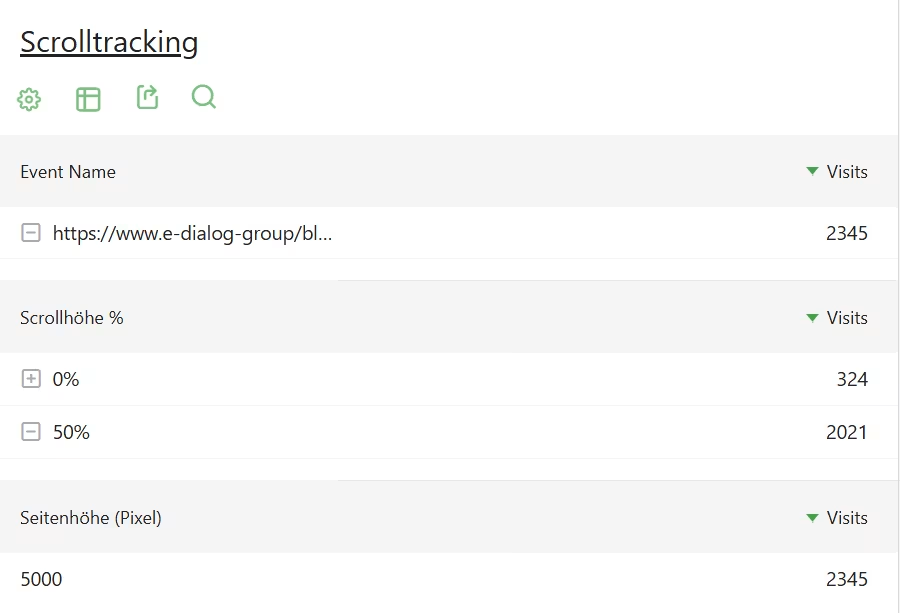
Navigate to Behavior > Events. Using the scroll action, you can now take a detailed look at specific URLs (event name) and view the average scroll depth (event value).
Alternatively, you can navigate to your reports on custom dimensions. By analyzing Dimension 10 (scroll_percentage), you can quickly get an overview of how many sessions across your entire website have reached the 25%, 50%, 75%, or 100% mark. If you notice a significant drop-off between 25% and 50%, you’ll know exactly where your content is losing readers’ attention.
Conclusion
Implementing a custom scroll tracking script via the Matomo Tag Manager is a resource-efficient and highly effective way to measure visitor engagement with your content. Calculating the maximum scroll depth when a visitor leaves the page and aggregating the metrics ensures clean and meaningful data without overloading your Matomo server with unnecessary requests.
Are you ready to find out how visitors really interact with your website? Copy the script above, set up the Matomo Tag Manager configuration, and start optimizing your content based on actual reading behavior.